Most landing page split testing programmes fail before the first visitor arrives. The problem isn’t the testing tool. It’s launching without a pre-set sample size, changing too much per variant, or stopping when a dashboard turns green. A credible test needs one deliberate change, one primary conversion event, and a stopping rule tied to business cycles.
The obvious answer is to test more ideas. That’s incomplete. Only 1 in 8 landing page A/B tests reaches statistical significance, while reported success rates for split tests sit around 11% to 15%, according to industry conversion testing guidance. Better decisions beat a larger backlog.
What Landing Page Split Testing Actually Is
Landing page split testing is a controlled experiment that compares page variants with matched traffic and adopts the stronger performer after a pre-set evidence threshold is reached. It isn’t a button-colour lottery, and it isn’t choosing whichever page leads after a busy afternoon.
A proper experiment contains four moving parts:
- Control: The existing landing page, sometimes called the champion.
- Challenger: A page variant designed to test one specific belief.
- Traffic allocation: Visitors are randomised between versions, commonly with a 50/50 split, as described in standard landing page testing guidance.
- Primary conversion event: The business action that decides the test, defined before launch.
The control gives you a reference point. The challenger gives you a falsifiable alternative. Without both, you’re just redesigning a page and hoping the paid traffic behaves.
Practical rule: If you can’t write the change in one sentence, you’re probably testing several things at once.
A good hypothesis names the audience, variant, KPI and expected direction. “A shorter headline will increase completed lead forms among paid mobile visitors” is testable. “Make the page clearer” is not.
The hard truth is that most experiments don’t produce a dependable winner. Traffic gets sliced too thin, teams stop on a peak, or the page receives a different audience halfway through. Unbounce’s testing examples describe the champion and challenger model, while independent CRO guidance says valid tests often need 100 to 200 conversions per variant and about two full business cycles, typically around two weeks.
That’s why Crank11 treats testing as an operating discipline, not a feature inside a page builder. The decisions that matter are simple:
- Set the sample size before launch.
- Make one deliberate change per variant.
- Stop according to the required evidence and business cycles, not impatience.
Our landing page experimentation guide is built around those decisions, because the page only improves when the learning is trustworthy.
The Math Behind a Test Worth Running
A test worth running starts with four inputs, not a visual editor. Set the baseline conversion rate, minimum detectable lift, confidence level and statistical power before anyone writes variant copy.
Use the last 30 days of clean landing page data for the baseline. A seven-day snapshot is too exposed to weekday mix, campaign changes and random traffic quality. Then choose an MDE, or minimum detectable effect, that could justify the work. A 10% to 15% relative lift is a sensible operating range for many paid-traffic decisions, while chasing a tiny change can make the test impractically long.
Set confidence at 95% and use a two-tailed test. Testing guidance commonly treats 95% confidence as the normal significance bar. Use 80% statistical power, the standard planning setting described in CRO research, rather than accepting whatever a calculator chooses.
Sample size by baseline conversion rate and minimum detectable lift
The table below is a planning view, not a substitute for a proper calculator. Required visitors vary with the test design, allocation, confidence and power.
| Baseline CR | 5% MDE | 10% MDE | 15% MDE | 20% MDE |
|---|---|---|---|---|
| 1% | Higher traffic need | Higher traffic need | Substantial traffic need | Substantial traffic need |
| 3% | Very high traffic need | High traffic need | Meaningful traffic need | Meaningful traffic need |
| 6.6% | High traffic need | Meaningful traffic need | Moderate traffic need | Moderate traffic need |
The practical maths matters more than the table. Suppose the page converts at 3%, your MDE is 12%, confidence is 95%, and power is 80%. If the calculator requires 2,400 conversions per variant, and each variant receives 50 conversions per day, the duration is:
2,400 conversions ÷ 50 conversions per day = 48 days
That means roughly 48 days of running, not a quick read after a weekend. At a 3% baseline, the corresponding visitor requirement is about 80,000 visitors per variant, because 2,400 conversions divided by 0.03 equals 80,000 visitors.
Traffic allocation changes the calendar. If the same total traffic is spread across more variants, each variant collects evidence more slowly. Halving a variant’s visitor flow roughly doubles the time required to reach its target.
Don’t pad the baseline with internal traffic. Don’t count scroll depth as a conversion. Both contaminate the event you’re trying to estimate.
For a practical planning process, use a cost and capacity calculator for paid acquisition decisions, then record the baseline, MDE, confidence, power, allocation and expected duration in the test brief. Landing Analytics’ experiment documentation also stresses sample-size planning, secondary metrics and avoiding premature reads.
Split URL Testing vs Standard A/B Testing
Choose standard A/B testing for a contained page change. Choose split URL testing when the page concept itself is changing. The wrong execution path can create technical noise that overwhelms the marketing question.
Standard A/B testing keeps one URL and changes the page presentation, usually through the page’s rendering layer. That keeps the address consistent, avoids redirects and concentrates the page’s SEO signals in one location. It’s the cleaner choice for a CTA label, headline, form prompt or another change that sits within the existing layout.
Split URL testing sends visitors to different URLs. It suits a wholesale redesign, a different information architecture or a cross-domain experiment, especially where a non-technical team needs to publish distinct page versions. The trade-offs are real. Redirect latency, canonicalisation, cookie assignment and query-parameter persistence all need attention.
Standard A/B testing vs split URL testing at a glance
| Dimension | Standard A/B | Split URL |
|---|---|---|
| Best use | One contained page change | Wholesale redesign |
| URL structure | One page address | Separate page addresses |
| Engineering need | Rendering logic may be required | Separate pages can be published independently |
| Redirect risk | No redirect between variants | Redirect or routing latency can affect experience |
| SEO handling | One canonical page location | Canonical tags and indexing rules require care |
| Cross-domain use | Awkward | More suitable |
| Main failure mode | Flicker or incomplete DOM control | Duplicate content or inconsistent assignment |
Use this decision rule:
- Test below the fold or only the primary CTA copy: Standard A/B.
- Test a new page architecture or full visual direction: Split URL.
- Work with a non-technical publishing workflow: Split URL can be practical.
- Need to compare domains: Split URL.
Don’t run both methods against the same paid source during the same period. You’ll create overlapping assignment logic, muddy conversion attribution and make the result difficult to reconcile. Recent split-testing guidance highlights the persistent confusion around the terms, which is precisely why the decision should be based on the size of the change, not the label in the platform menu.
Running a Test From Hypothesis to Result
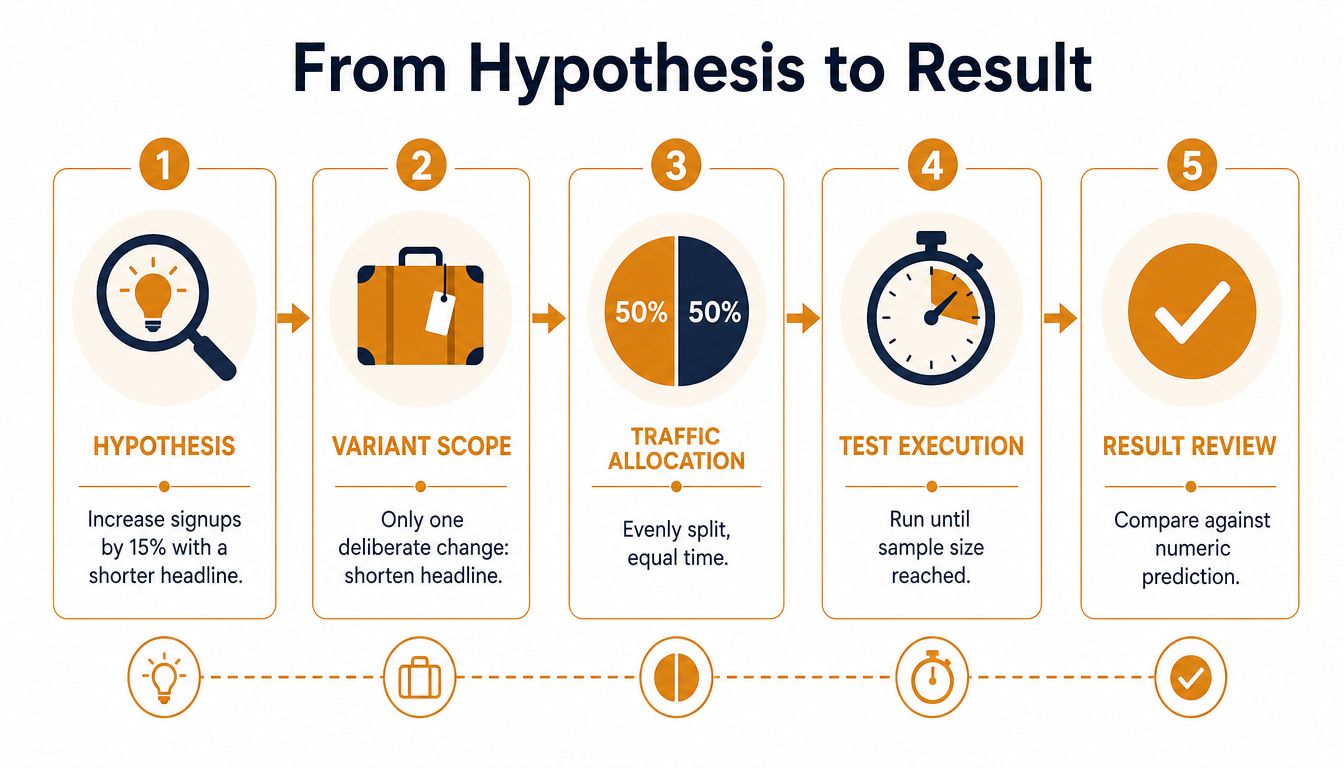
A test becomes useful when the brief is more specific than the page. Write the prediction, define the audience, isolate the change, calculate the required sample and set the launch and stop dates before traffic moves.
The hypothesis should contain five fields:
- Variant: What changes?
- Audience: Who is included?
- KPI: What primary conversion counts?
- Prediction: What relative lift do you expect?
- Evidence target: What sample size is required?
For example, “The challenger will increase completed signups by 15% among paid mobile visitors by replacing the long headline with a shorter benefit-led headline.” That gives the copywriter a boundary and gives the analyst a result to assess.
Don’t change the headline, hero image, form length and trust section in the same challenger. If it wins, you won’t know why. If it loses, you won’t know what to keep.
Calculate the calendar before launch
Suppose the page receives 8,000 daily visitors, the baseline conversion rate is 3%, and the MDE is 15%. At a 50/50 split, each variant receives about 4,000 visitors per day. The control therefore produces roughly 120 conversions per day, because 4,000 multiplied by 0.03 equals 120.
If your sample-size calculation requires 2,400 conversions per variant, the calendar estimate is:
2,400 required conversions ÷ 120 daily conversions = 20 days
That is a planning estimate, not permission to stop on day 20 if the traffic allocation failed, tracking broke or the business cycle wasn’t represented. Experiment guidance recommends checking sample size, page performance and secondary behaviour rather than relying on a fixed timer.
Before launch, log:
- Baseline: Last 30 days of eligible traffic and primary conversions.
- Scope: The single deliberate change and excluded elements.
- Allocation: Variant split, audience rules and device coverage.
- Tracking: Primary event, revenue event, assisted event and QA status.
- Media conditions: Campaigns, budgets, audiences and creative versions.
- Dates: Launch date, expected sample date and earliest permitted review.
- Stop rule: The evidence threshold and business-cycle requirement.
Keep the brief in one place. A structured testing brief should make it impossible to rewrite the hypothesis after seeing the result.
Why p Less Than 0.05 Is Not the End
A result below p = 0.05 tells you the observed difference is unlikely to be explained by sampling noise under the test assumptions. It doesn’t tell you that the winner deserves to ship across every traffic source, device or customer type.
That distinction matters for paid acquisition. A variant can increase form completion while producing weaker leads, lower revenue per visitor or worse downstream retention. Conversion rate is the primary decision metric, not the entire business.
The checks that protect the decision
| Metric | What it catches | Pass condition |
|---|---|---|
| Revenue per visitor | Low-value conversions | Revenue quality doesn’t fall |
| Assisted conversions | Funnel damage after the landing page | Downstream contribution remains healthy |
| Refund or churn signals | Poor-fit signups or buyers | Customer quality remains acceptable |
| Device segment | Mobile or desktop-specific failure | No material segment break |
| Traffic source | Paid and organic audience mismatch | Direction holds across major sources |
Ask three questions before promoting the challenger:
- Does the lift remain when paid and organic traffic are separated?
- Does the result hold on mobile as well as desktop?
- Does a one-week replication check point in the same direction with the same audience?
That replication check isn’t a replacement for the main experiment. It’s a guard against shipping a fragile result that appeared during an unusual traffic mix.
Industry landing-page statistics report an average 49% conversion lift among companies that actively A/B test, but the same summary says only 17% of marketers actively test landing pages and only 1 in 8 tests reaches significance. Those figures describe an uneven discipline, not a promise for any individual page.
The operator’s job is to protect the business metric. A statistically significant increase in low-quality leads is not a win. It’s a cheaper way to create a sales problem.
Reading the Result Without Fooling Yourself
Three operational errors ruin otherwise competent experiments: peeking, mobile blindness and tracking drift. Fix them with written controls, segment checks and a frozen media plan.
Peeking turns noise into a decision
Checking the dashboard early feels responsible. It isn’t. Early data has a larger random component, and the first green result can reverse once the sample fills out. Landing-page experiment guidance warns that premature reads distort decisions, particularly with mobile-heavy traffic.
Write the sample target and stop date before launch. Hide interim results from anyone who can call the test early. A dashboard is a measurement interface, not a decision rule.
Desktop QA doesn’t protect mobile buyers
A page can look correct on a large screen and fail at the point of tap, scroll or form completion on a phone. Analyse device segments separately before reading the blended result, then check whether the allocation and tracking are balanced.
Tracking drift creates fake movement
Tag changes, redirect edits, campaign budget shifts and creative swaps can change who reaches the page or whether the conversion is recorded. Freeze the tracking stack and media plan for the test window, or document every change well enough to explain its effect.
That morning-after review should follow this order:
- Confirm both variants reached the pre-set sample.
- Confirm the primary event fired consistently.
- Check allocation by device and source.
- Review revenue or lead quality.
- Inspect campaign and tracking changes.
- Decide whether to ship, replicate or archive.
Use the same evidence that justified the sample-size plan. Don’t let the first dashboard view become the methodology.
For a wider health check, use this practical ad account audit process to identify campaign or tracking changes that could compromise the read.
Building a Testing Programme That Compounds
A structured backlog beats an idea-of-the-week queue. One test answers one question, but a documented programme lets each result improve the design of the next experiment.
Build the backlog from evidence already sitting inside the business:
- Funnel drop-offs: Find the step where intent disappears.
- Sales objections: Pull repeated friction from call recordings, tickets and notes.
- Competitive gaps: Compare the claims, proof and page structure that buyers encounter elsewhere.
- Paid traffic behaviour: Separate creative promise from landing-page delivery.
Score every idea on potential lift, implementation effort and traffic required. A high-impact redesign with insufficient traffic isn’t a priority. It’s a future project pretending to be a test.
Cap testing at one experiment per page unless the page has enough traffic for each experiment to reach its sample target inside one business cycle. Parallel tests that share the same visitors create interaction effects, especially when both variants change the message or offer.
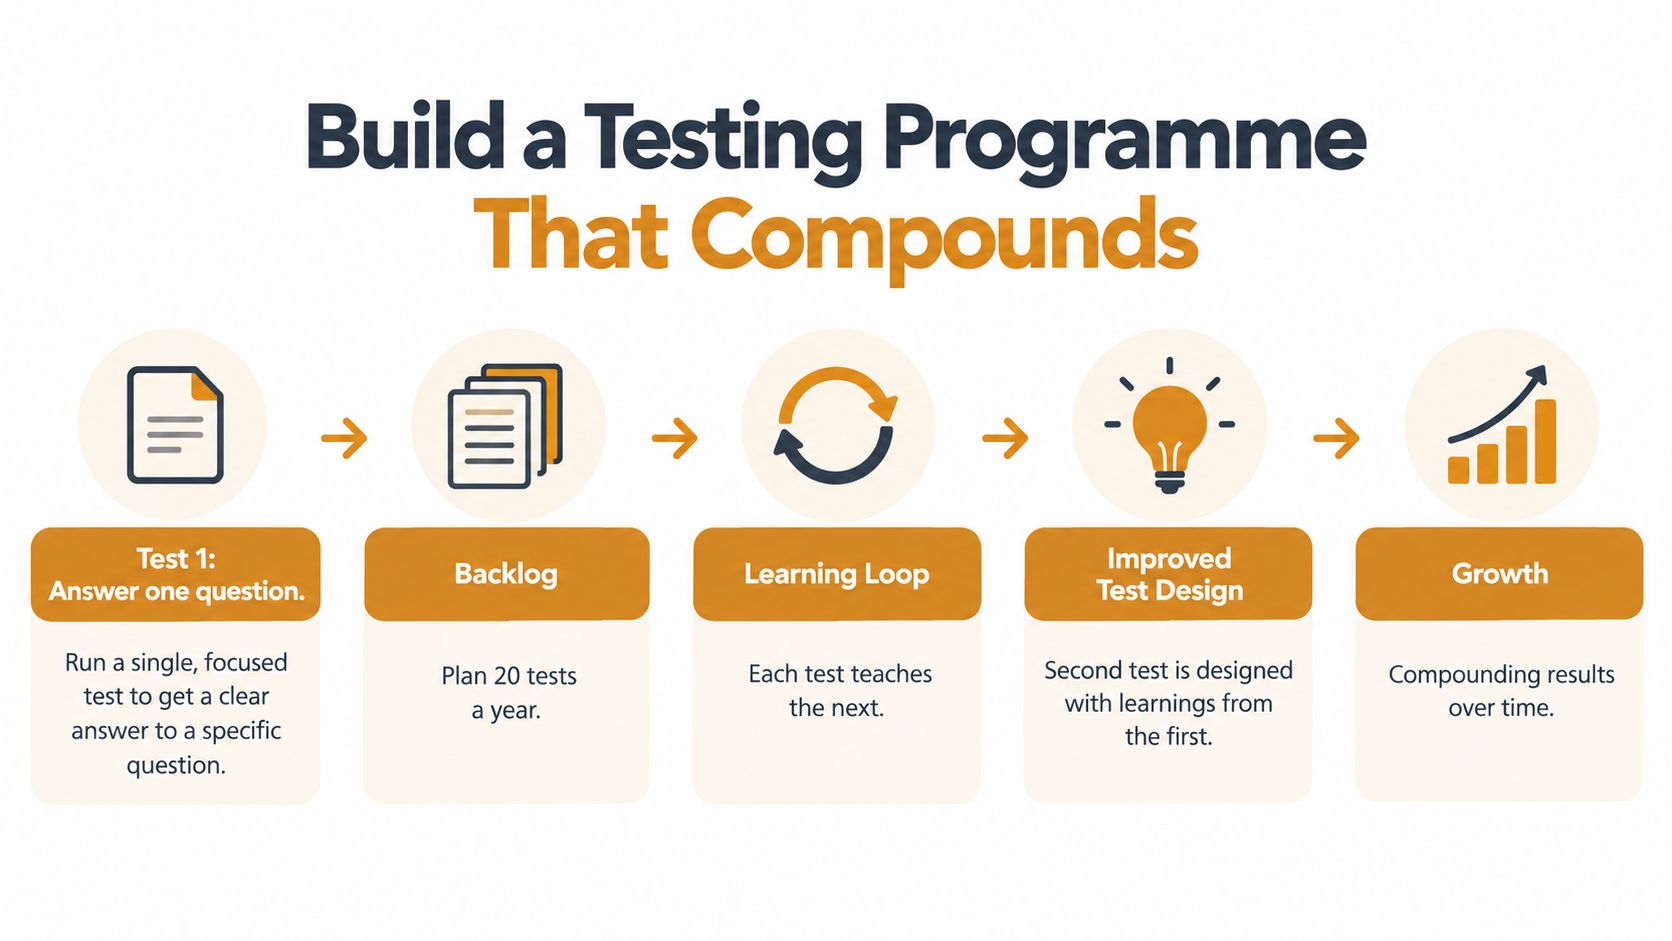
Ship the winner as the new control. Then record what changed, who it affected, which metric moved and what remained uncertain. Review the backlog monthly, remove ideas that no longer fit the page and promote fresh hypotheses from customer evidence.
The cycle is straightforward:
Hypothesise, queue, test, ship, learn, repeat.
Don’t confuse activity with progress. Creative fatigue production maths is useful here because landing pages and ads share the same constraint, every new test consumes traffic, attention and operating capacity.
Crank11 applies this process alongside paid media, creative production, funnel builds and CRO, with senior operators signing off the work and no junior staffing on accounts. See how Crank11 connects the traffic source, landing page and measurement system into one testing rhythm.
A landing-page split test should answer one commercial question, not decorate a reporting dashboard. Tomorrow morning, write the hypothesis, sample target and stop rule before changing a line of copy, then use the playbook to run the test cleanly.
[[C11-OPTIN]]
Quick answers
What is landing page split testing?
It’s a controlled comparison of page variants, usually with randomised traffic, one primary conversion event and a pre-set evidence threshold. The winner is the version that improves the agreed business metric without damaging downstream quality.
Should I use a 50/50 traffic split?
Usually, yes. Equal allocation gives both variants comparable exposure during the same period and reduces traffic-quality bias, as explained in landing-page split allocation guidance.
How long should a landing page test run?
Run until the pre-set sample size is reached and the result covers the relevant business cycles. Guidance commonly recommends at least two full business weeks or one to two weekly cycles, rather than stopping after an early dashboard change, according to current testing recommendations.
Should I test a whole redesign?
Use split URL testing when the change is broad enough that isolating one element would be misleading. Use standard A/B testing for a contained headline, CTA or form change.
What should decide the winner?
Use one primary conversion KPI, then check revenue per visitor, lead quality, device segments, traffic sources and downstream outcomes. A higher conversion rate alone isn’t enough.