
Cost per customer acquisition is the total acquisition spend divided by net new customers in a defined window. In practice, the number you see in ad platforms is often paid CAC, not your real all-in acquisition cost, and that gap is where most strategy errors start.
The obvious advice is wrong because it treats one dashboard number like truth. In reality, paid media, creative, software, labour, incentives, and onboarding all sit in the same pile if you care about actual unit economics.
What cost per customer acquisition actually means
Cost per customer acquisition is a Y that measures total acquisition spend divided by net new customers over a fixed period. That sounds tidy. It usually isn’t.
The lazy version only counts platform spend. That’s how operators end up defending a $48 dashboard CPA while finance carries a much uglier number once the rest of the acquisition machine is loaded in. The useful question is not “what did Meta report?”, it’s “what did we spend to win one customer, and how much of that cost is recoverable through repeat purchase or retention?”
The four inputs people undercount
The number usually includes paid media spend, creative and production, agency or tooling fees, and the internal labour tied to acquisition. Miss any one of those and the number turns into fiction with a spreadsheet on top.
A platform-reported CPA can look clean because it only sees the click path it can track. Once you add designer hours, creative testing budget, and the retainer sitting outside the ad account, the number changes fast. In one simple working example, a $48 reported CPA becomes $112 once those costs are loaded. That’s not a rounding error, that’s a different business.
| Component | Platform-reported CPA | All-in acquisition cost |
|---|---|---|
| Media spend | Included | Included |
| Creative production | Omitted | Included |
| Agency or tooling fees | Omitted | Included |
| In-house labour | Omitted | Included |
| Reported result | $48 | $112 |
Practical rule: if a cost touches acquisition, it belongs in the model somewhere. If it doesn’t, you’re comparing dashboards, not economics.
The other trap is the time window. A 7-day attribution window and a 90-day customer window are not the same denominator, and pretending they are wrecks any finance meeting. Pick one window, write it down, and use it consistently. Otherwise, you end up “improving” CPA on paper while the actual customer economics drift in the opposite direction.
If you want a clean account-level read on what’s being wasted, the free ad account audit at Crank 11 audit is built for exactly that kind of diagnosis.
[[C11-OPTIN]]
CPA versus CAC versus blended CAC
These three numbers get mixed up because people want one tidy answer. That’s expensive. CPA, CAC, and blended CAC answer different questions, and using the wrong one in the wrong meeting leads to bad budget decisions.
The difference that matters
CPA is usually channel or campaign level. CAC is company level, rolling every acquisition dollar against every new customer. Blended CAC mixes paid and organic into one denominator, so SEO, referrals, outbound, and paid media all sit in the same pot.
A working budget example makes this plain. If a business spends $1.2M on acquisition across paid, organic support, and sales effort, the same customer base can produce a $72 paid CPA, a $94 blended CAC, and an $81 total CAC depending on what is counted and where. The numbers can all be “true” and still be useless if they’re used interchangeably.
| Metric | Includes | Use it for |
|---|---|---|
| CPA | A specific campaign or channel | Media decisions |
| CAC | All acquisition spend tied to new customers | Unit economics |
| Blended CAC | Paid and organic acquisition together | Board-level reporting |
The mistake I see most often is simple. Teams treat paid CPA as if it were total CAC, then wonder why margins don’t match the dashboard. Or they use blended CAC to judge a channel buyer, which is nonsense because the channel buyer didn’t control the referral engine or organic demand.
Rule: paid CPA belongs in media meetings, total CAC belongs in finance and unit economics, blended CAC belongs in board reporting only.
If you’re deciding whether to keep spend in-house or push it out, the cost maths in agency versus in-house cost math is the cleaner frame.
The break-even formula that decides if your CPA is good
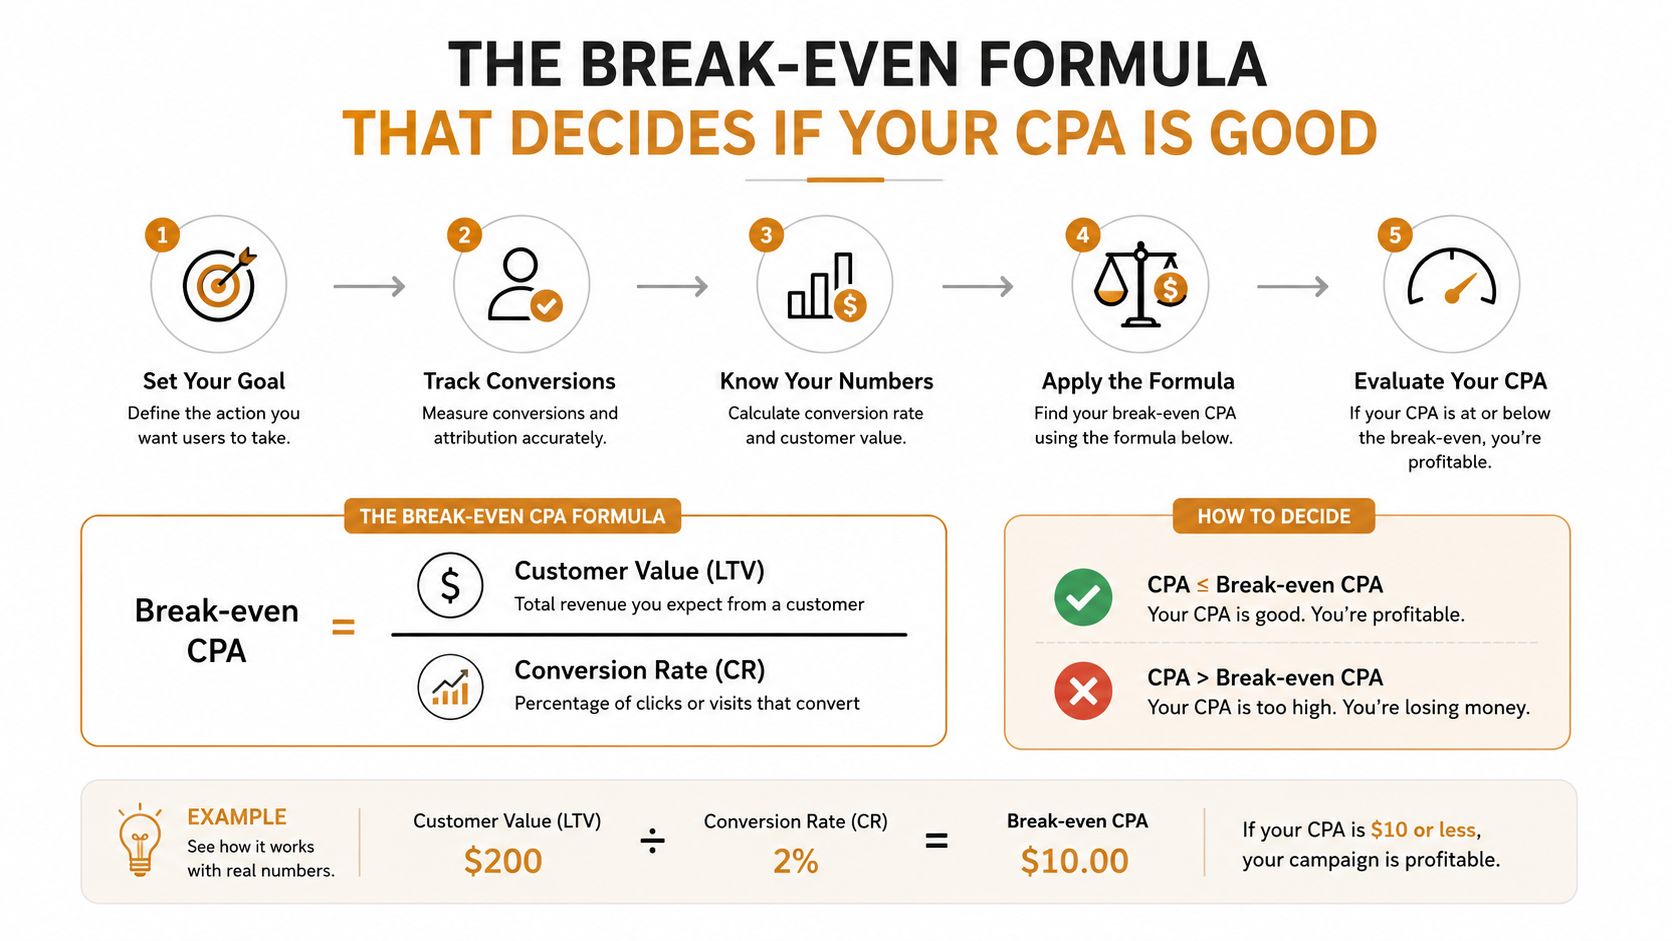
A good CPA is the one that stays under your allowable acquisition cost. The right model starts with gross margin, LTV, and payback, not with auction intuition.
Use margin, not vibes
The basic rule is simple. Allowable CPA equals gross margin percentage multiplied by predicted 12-month LTV, with a payback cap based on cash position. That is the number you should compare against actual acquisition cost.
Take a DTC skincare brand. If gross margin is 62% and predicted 12-month LTV is $148, the allowable CPA is $91.76. If the business also runs a 180-day payback rule, that same ceiling tightens to roughly $62, because cash comes back slower than the first formula suggests.
A B2B SaaS business looks nothing like that. With 78% gross margin, $4,200 LTV, and a 12-month sales cycle, an allowable CPA of $1,300 can make sense, while sub-$800 spend may be underfunded rather than efficient. Cheap is not always healthy. Underbuying demand can starve the pipeline.
The ratio that travels across verticals is LTV to CPA. A 3:1 benchmark is a filter, not a verdict. If you are above your allowable CPA, the fix is rarely “bid harder”. It’s usually the upstream funnel, the offer, the retention model, or the margin structure.
Decision rule: if actual CPA is above allowable CPA, stop fiddling with bids first. Fix the business model inputs the bids are sitting on.
What good CPA looks like by channel and vertical
Benchmarks are useful only as ranges. A single average is where planning goes wrong. Channel mix and category mix move CPA more than most auction tweaks do.
Channel ranges that are actually worth using
For ecommerce, paid social often sits in a wide band, because creative quality and offer strength swing the result. Search is usually tighter on brand terms and much looser on non-brand. Programmatic display is often expensive relative to direct response value unless it is part of a longer path.
| Channel or Vertical | Typical CPA range (USD) | Primary driver of variation |
|---|---|---|
| Ecommerce paid social | $45 to $120 | Creative quality and offer fit |
| Google Search, branded | $20 to $80 | Brand demand and query intent |
| Google Search, non-brand | $60 to $300 | Competition and intent depth |
| Programmatic display | $200 to $600 | Assisted value and attribution |
| Ecommerce vertical | $68 to $84 | Basket definition and channel mix |
| B2B SaaS | $200 to $700 | ACV and sales cycle |
| Financial services | $300 to $800 | Compliance and conversion friction |
| Higher education | About $1,000 and above | Sales motion and long consideration |
| Home services | About $1,000 and above | Local competition and lead quality |
The point is blunt. Ecommerce can live in one range, while higher education can sit far above it, and both can be perfectly rational. A $90 ecommerce CPA can be excellent. A $400 SaaS CPA can also be excellent. A $70 ecommerce CPA can still be a mess if margin and repeat rate can’t support it.
This is why the average is a trap. Recent benchmark coverage says paid CAC is 2.4x to 3.1x blended CAC in many categories, and that same coverage shows wide segment spreads, from roughly $87 ecommerce CAC to $1,143 in higher education. The category spread is large enough that generic benchmarks can distort strategy if you use them without the business model attached. See the benchmark framing in customer acquisition cost benchmarks for 2026.
If you’re deciding how much of this should sit with a specialist, choosing a paid social agency is a better filter than chasing the cheapest monthly fee.
Measurement and attribution that protect the number
Most CAC pain is not just auction pressure. It’s measurement drift. As of 2026, privacy changes and platform changes make the number less stable than operators like to admit.
The measurement stack, in order
Start with pixel and SDK events for in-platform optimisation. Then add Conversions API or server-side tagging to recover what browsers strip away. Use Marketing Mix Modelling for cross-channel calibration, and multi-touch attribution for a journey-level read on assisted spend.
That order matters because each layer fixes a different kind of blindness. If the platform cannot see the event, it cannot optimise properly. If the server-side setup is sloppy, the platform will count partial truth as full truth. If you never reconcile platform revenue against your order management system, you’ll spend weeks debating a number that never matched reality.
A simple worked example shows the damage. A brand running a $50,000 monthly Meta campaign on a 7-day click window can lose roughly 15 to 25% of conversions to iOS attribution drift and ad blockers, so reported CPA reads $48 while true CPA lands closer to $58 to $62. The same blind spot can shift Google Search CPA too, especially when branded terms absorb demand the pixel never sees.
Hygiene that keeps finance from chasing ghosts
- Deduplicate events. Double-counting makes CPA look better or worse for the wrong reasons.
- Pass order ID and currency. If the payload is messy, reconciliation turns into guesswork.
- Keep the attribution window stable. Changing it mid-quarter breaks trend analysis.
- Reconcile weekly. Platform-reported revenue and order management revenue should be checked together.
- Treat any 10% variance as a measurement bug. Don’t call it a market move until the stack has been checked.
If your reporting is already wobbling, audit your own ad account before you touch bids again.
Where CPA moves when you push on it
Many teams waste time on bid changes before they fix the leak. At meaningful spend, creative quality and funnel construction explain most CPA variance, while bidding matters after the signal is clean.
Start where the damage begins
The first lever is offer-market fit and the hook in the first three seconds. If people do not stop, nothing else matters. Next comes landing page match to ad intent, then checkout or form friction, then audience signal quality fed back to the platform. Bid strategy and placement come after that.
A few diagnostics point to the break. Thumbstop ratio under 25% points to creative. Bounce rate above 60% points to the landing page. Checkout abandonment above 70% points to the funnel. CPM flat with falling conversion rate points to audience fatigue.
If the creative is weak, a bid change just buys more bad traffic at a different price.
That is why we do not recommend bid changes until the creative and funnel are clean. Bidding on a broken signal buys more of the wrong user, not better customers. It can also make CPA look controlled for a week or two, which is how teams congratulate themselves while the business keeps leaking.
The practical sequence is simple. If the first second of the ad fails, fix the ad. If the page feels off, fix the page. If the checkout is heavy, fix the checkout. Only once those are solid does bidding deserve attention.
Creative fatigue shows up in the same place, and it usually needs a production answer, not a bid tweak. If you need the math behind that, see creative fatigue and production math.
Crank11 uses that order of operations in its own creative and CRO work, because the same weak signal hurts Meta and Google in different ways but for the same reason.
A reporting template and quick diagnostic checklist
A weekly report should show the business, not just the media account. If it does not help a paid lead find the cause of CPA inflation in under an hour, it is decoration.
Weekly format operators use
| Channel | Spend | Attributed Customers | Paid CPA | All-in CAC | LTV:CPA Ratio | MER | Signal Health |
|---|---|---|---|---|---|---|---|
| Meta | |||||||
| Search | |||||||
| Other paid |
Keep the table lean. Add notes only when the number changed for a reason. If a channel’s paid CPA moved but all-in CAC stayed stable, the issue usually sits in attribution or cost allocation, not demand generation. If both moved, the problem is real.
A good report also shows where the measurement stack is weak. If the platform sees the wrong customers, the CPA number becomes a partial truth, not a decision tool. That is why the weekly review should pair the table with a short signal check and a clear owner for each line item.
Monday morning checklist
- Pixel match rate. If it slips, the platform is not seeing enough of the journey.
- CAPI event dedup. If browser and server both fire, check the count.
- View-through cap. Loose caps can flatter display and social.
- Holdout testing. If nothing is held out, incrementality is guessed.
- Incrementality lift. If lift is weak, the spend may be cannibalising.
- Creative freshness. Old hooks die.
- Audience saturation. Fatigue shows up before finance notices.
- Attribution window consistency. A moving window makes the trend useless.
- LTV cohort delay. Early cohorts rarely tell the full story.
- Blended versus paid gap. A widening gap usually means the model changed, not the market.
If you want a cleaner version of that template with a live operator review, start with a free Crank audit.
[[C11-OPTIN]]
Tomorrow morning, rebuild the report around paid CPA, all-in CAC, and payback, then check the signal health before you touch bids. If you want the full operating playbook, Crank 11 is where we run that process for brands spending serious money on paid traffic.