
Customer acquisition cost per customer formula is CAC = (total sales and marketing spend) ÷ new customers acquired in the same period. The most common mistake is ignoring fully loaded costs, which makes the number look healthier than it is.
That’s the polite version. The messier truth is that teams defend a fake CAC with the same fake LTV:CAC ratio, then wonder why cash gets tight when paid spend scales.
What the acquisition cost per customer formula actually is
CAC is the fully loaded sales and marketing cost of converting a first paying customer. That means the denominator is not leads, sign-ups, or booked calls, it’s new customers in the same time window as the spend. The canonical formula is simple, CAC = (Sales + Marketing Spend) ÷ New Customers Acquired, and the period has to match on both sides of the equation, month to month or quarter to quarter, or the ratio lies. Paddle’s CAC timing guidance is clear that costs and customers must come from the same defined period.
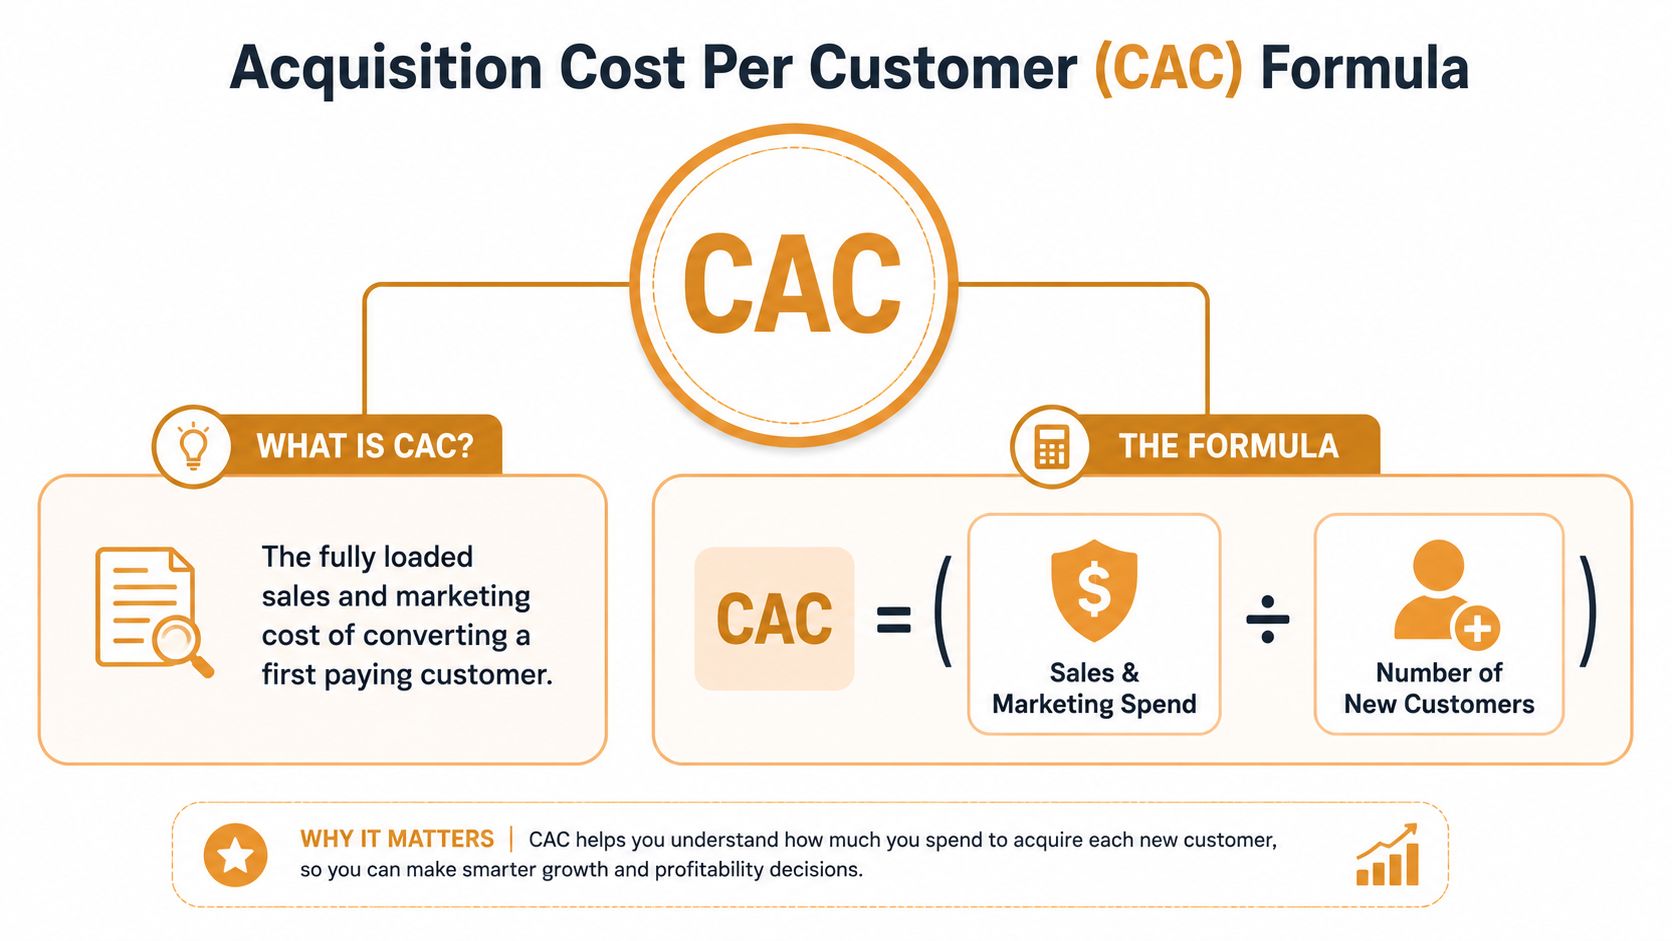
The most common numerator mistake is leaving out anything that isn’t ad spend. We rebuild ledgers with media, creative, salaries, tooling, agency fees, and sales comp in the numerator because each one is acquisition cost, not overhead fairy dust. Wall Street Prep is explicit that fully loaded CAC should include ad spend, salaries, software, creative production, and other acquisition overhead.
Here’s the maths. A DTC brand spends $40,000 on media, $8,000 on creative, $6,000 on marketer salaries, and $1,500 on tooling, then acquires 500 new customers. Platform-reported CAC says $80, but the actual figure is $111. That’s a 39 percent understatement, and it’s exactly how teams end up defending an acquisition model that isn’t working.
=((Media+Creative+Salaries+Tooling))/NewCustomers is the spreadsheet syntax. Exclude any of those four lines and you’re not measuring CAC, you’re measuring a nicer story.
Practical rule: if the line item helped acquire the customer, it belongs in the numerator.
Crank11’s agency-vs-in-house cost maths note is useful here because it forces the same question from another angle, what did you spend to make the sale happen?
Blended, channel and cohort CAC variants with worked numbers
Use blended CAC for board-level truth, channel CAC for budget decisions, and cohort CAC for payback and LTV work. They are not interchangeable, and pretending they are is how spend gets misallocated. Blended CAC tells you what the whole machine costs. Channel CAC tells you where one platform is leaking. Cohort CAC tells you whether a customer group eventually earns its keep.
| Variant | Numerator | Denominator | Formula | When to use |
|---|---|---|---|---|
| Blended CAC | Fully loaded sales and marketing spend | All new customers in the same period | Total acquisition cost ÷ total new customers | Board reporting, pricing, planning |
| Channel CAC | Spend from one channel, plus its channel-level load | New customers attributed to that channel | Channel spend ÷ channel customers | Budget allocation, channel diagnosis |
| Cohort CAC | Cost incurred in a cohort month | Customers acquired in that cohort | Cohort cost ÷ cohort customers | LTV modelling, payback analysis |
A workable example makes the distinction obvious. If fully loaded spend is $55,000 and the business acquires 500 customers, blended CAC is $110. If Meta alone spends $20,000 to deliver 220 customers, channel CAC is $91. If April cohort cost is $9,000 and it produced 80 customers, cohort CAC is $113 to date.
Use blended CAC when the finance team asks whether the growth engine is sane. Use channel CAC when a paid channel looks expensive and needs a decision. Use cohort CAC when retention, expansion, or delayed conversion will affect the answer later.
Decision rule: if you’re choosing where to cut or add budget, channel CAC wins. If you’re deciding whether the business model works, blended CAC wins.
The fastest way to ruin this analysis is to force one number to answer three different questions. It won’t.
This account-audit checklist is worth keeping nearby if a channel number looks off and you need to separate waste from measurement noise.
[[C11-OPTIN]]
Use the CAC ledger template from this section to separate blended, channel and cohort numbers without guessing.
Attribution, time windows and the numerator you keep forgetting
The time window has to match on both sides of the equation, or the answer becomes decorative. Spend in one month divided by customers from another month is not CAC, it’s arithmetic theatre. In real accounts, moving the window can change the figure materially, which is why people argue about it and still end up wrong.
A common reconciliation looks like this. Meta reports 250 conversions on $8,000 spend, so platform CAC looks like $32. Back-end records show only 180 first-time paying customers in the same window, so matched CAC becomes $44. The platform isn’t lying, it’s counting a different event.
Attribution choice changes the denominator too. Last-click is useful for diagnosis because it’s blunt and easy to reconcile. Data-driven can be helpful for modelling, but if the accounting team can’t tie it back to actual first purchases, don’t use it for cash decisions. The numerator also needs the ugly lines people drop, agency fees, video production, retention tooling tied to acquisition, and a pro-rata share of the CMO salary.
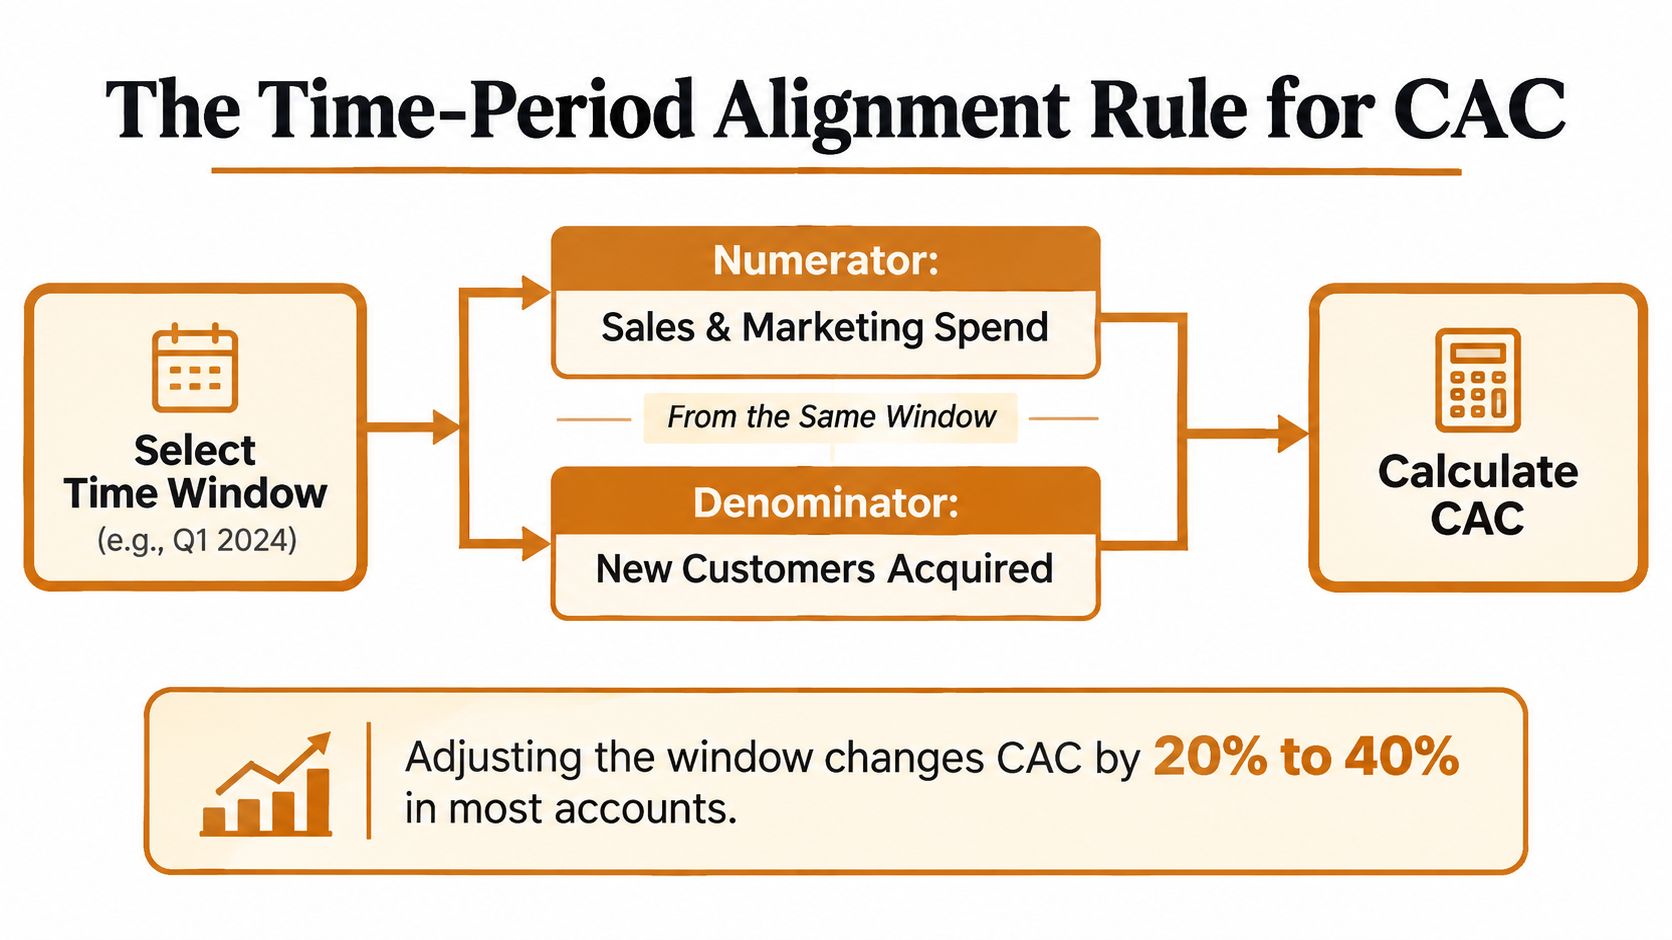
The point of the matched window is simple. A customer acquired late in the month often books revenue later, but the spend happened now. If you don’t align the period, you’ll think one channel is brilliant and another is broken, when all that changed was timing.
Practical rule: use the same window, the same event definition, and the same customer count source every time. Change one variable and you’ve changed the ratio, not improved the business.
Crank11’s Meta account audit notes are the right companion piece when a platform figure and backend figure refuse to reconcile.
Why payback beats LTV to CAC as a decision metric
Payback beats LTV:CAC for high-spend operators because it is harder to fake. LTV is built on churn assumptions, expansion modelling, discount rates, and a pile of optimism nobody agrees on. Payback uses cash reality. That’s the number that matters when spend is moving faster than confidence.
The gross-margin-adjusted payback formula is CAC ÷ monthly gross profit per customer, and monthly gross profit is ARPU × gross margin. A SaaS business with $320 CAC, 78% gross margin, and $299 monthly plans pays back in about 1.4 months. An ecommerce business at the same $320 CAC but 22% gross margin takes about 9 months. Same CAC. Very different capital demand.
| Variable | SaaS example (78% GM) | Ecommerce example (22% GM) |
|---|---|---|
| CAC | $320 | $320 |
| Monthly price or revenue per customer | $299 | same spend, but lower margin structure |
| Gross margin | 78% | 22% |
| Monthly gross profit | higher | lower |
| Payback outcome | about 1.4 months | about 9 months |
That’s why the 3:1 LTV:CAC target is useful but not decisive. A business can hit the ratio and still choke on cash if payback is slow. For operators spending hard, anything past 12 months payback is a refactor signal, not a polishing exercise.
I’d rather see a slightly ugly payback number with clean inputs than a beautiful LTV:CAC built on assumptions nobody can defend in a room with finance.
CAC benchmarks by business model and the 2026 pressure on the numerator
Benchmarks matter less than structure, but they still stop bad intuition from running the room. HubSpot’s 2025 to 2026 benchmark table reports average CAC of $86 for ecommerce, $239 for B2B SaaS, and $784 for financial services, which shows how sales complexity and trust barriers widen acquisition economics even under the same formula. HubSpot benchmark table
A second reference point from 2026 benchmark summaries shows much higher median figures in more complex SaaS motions, including $702 for B2B SaaS self-serve, $3,840 for mid-market sales-led SaaS, and $11,400 for enterprise sales-led SaaS. DataPartners CAC statistics The spread is the point. A simple formula can still produce wildly different answers depending on trust, deal length, and human intervention.
| Business model | Median CAC range | Primary 2026 cost driver |
|---|---|---|
| Ecommerce | $45 to $127 | Rising paid media costs |
| SaaS | $205 to $450 | Longer sales motion and higher acquisition overhead |
| Financial services | higher, trust-heavy range | Trust barriers and compliance friction |
The pressure on the numerator is real. Independent 2026 coverage says acquisition costs are still rising, with privacy changes, auction saturation, and higher CPCs pushing spend upward. Growsurf’s CAC statistics roundup If the same acquisition cost number now needs more efficiency to hold, the business either needs a conversion lift or a higher AOV, because the market won’t subsidise the gap for you.
Crank11’s creative production notes are relevant here only because better creative is one of the few clean ways to fight a rising numerator without pretending the market hasn’t changed.
Six diagnostic moves that lower a high CAC without more budget
High CAC is usually a symptom, not a disease. If the account is healthy, one of six things is off, the landing page, the audience, the creative, the bidding, the basket, or the offer. Fix the one that matches the signal, not the one that sounds fashionable.
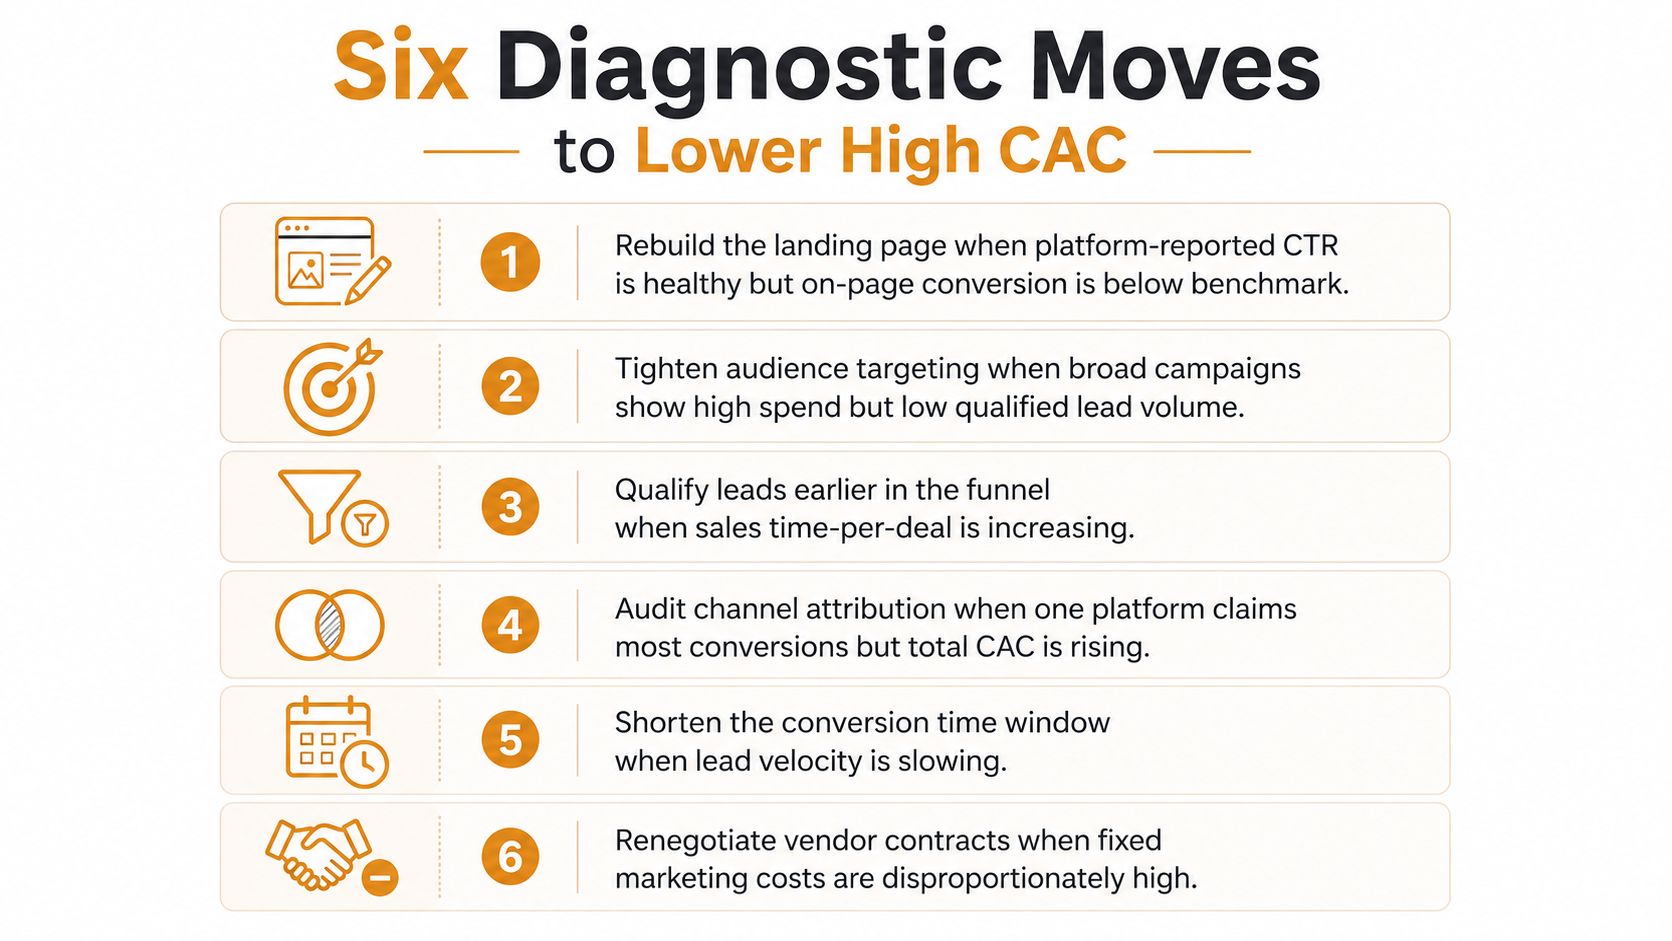
The six moves
- Rebuild the landing page when platform CTR is healthy but on-page conversion is below 2%. The traffic isn’t the problem, the page is.
- Tighten the audience when Meta frequency exceeds 3.5 in a 7-day window. That’s saturation, not scale.
- Restructure creative into a 3-hook, 3-body, 3-CTA matrix when thumb-stop rate drops below 25% on short-form placements.
- Move to value-based bidding on Google when conversion volume exceeds 30 per week per ad group. Anything less and the machine is starved.
- Add a post-purchase upsell when blended AOV is under $60 and margin allows it. You’re not lowering CAC, you’re spreading it better.
- Audit the offer when creative and targeting both plateau. That usually means the market likes the ad but doesn’t love the product at the current price.
The cleanest part of this checklist is that each move tells you what not to do. Don’t pour more spend into a page that leaks. Don’t chase reach when frequency is already hot. Don’t call it a creative problem when the offer is the friction.
Practical rule: if three fixes fail in sequence, stop optimising the campaign and interrogate the economics.
This creative fatigue and production maths note is the right next read if the account is burning through assets faster than it’s buying customers.
What to do with this tomorrow morning
Pull the last 90 days of spend from every paid channel, add salary allocation, creative, tools, agency retainer, and payment fees, then divide by new customers in the same window. Write the blended CAC on one line, build a channel table, and flag anything above 1.5x the blended figure before the next billing cycle.
That 90-minute audit is the playbook. If you want the reconciliation done properly, Crank 11 can run the fully loaded ledger, attribution check, and payback model against your actual gross margin.
[[C11-OPTIN]]
Quick answers
What does CAC stand for, and what’s the formula? CAC stands for customer acquisition cost. The formula is total sales and marketing spend ÷ new customers acquired in the same period.
What’s the most common mistake? Leaving out fully loaded costs. If you ignore salaries, creative, tooling, or sales overhead, CAC looks better than it is.
How is CAC different from CPA? CAC measures the cost to acquire a paying customer. CPA measures the cost of an action, like a lead or sign-up.
How do I calculate it in a spreadsheet? Sum all acquisition cost rows for the period, then divide by new customers for that period. Use SUMIFS for channel-level cuts.
Should I trust LTV:CAC or payback more? Payback. LTV depends on assumptions that compound error. Payback tells you how fast the business gets cash back.
Can attribution change CAC a lot? Yes. Using different windows or attribution models can move the answer by 20% to 40% in many accounts.
If you want the fully loaded number rebuilt properly, use the next Monday morning to audit your last 90 days and separate blended CAC from channel CAC. If you’d rather have senior operators do the ledger, attribution reconciliation, and payback model with your actual margin, visit Crank 11.