
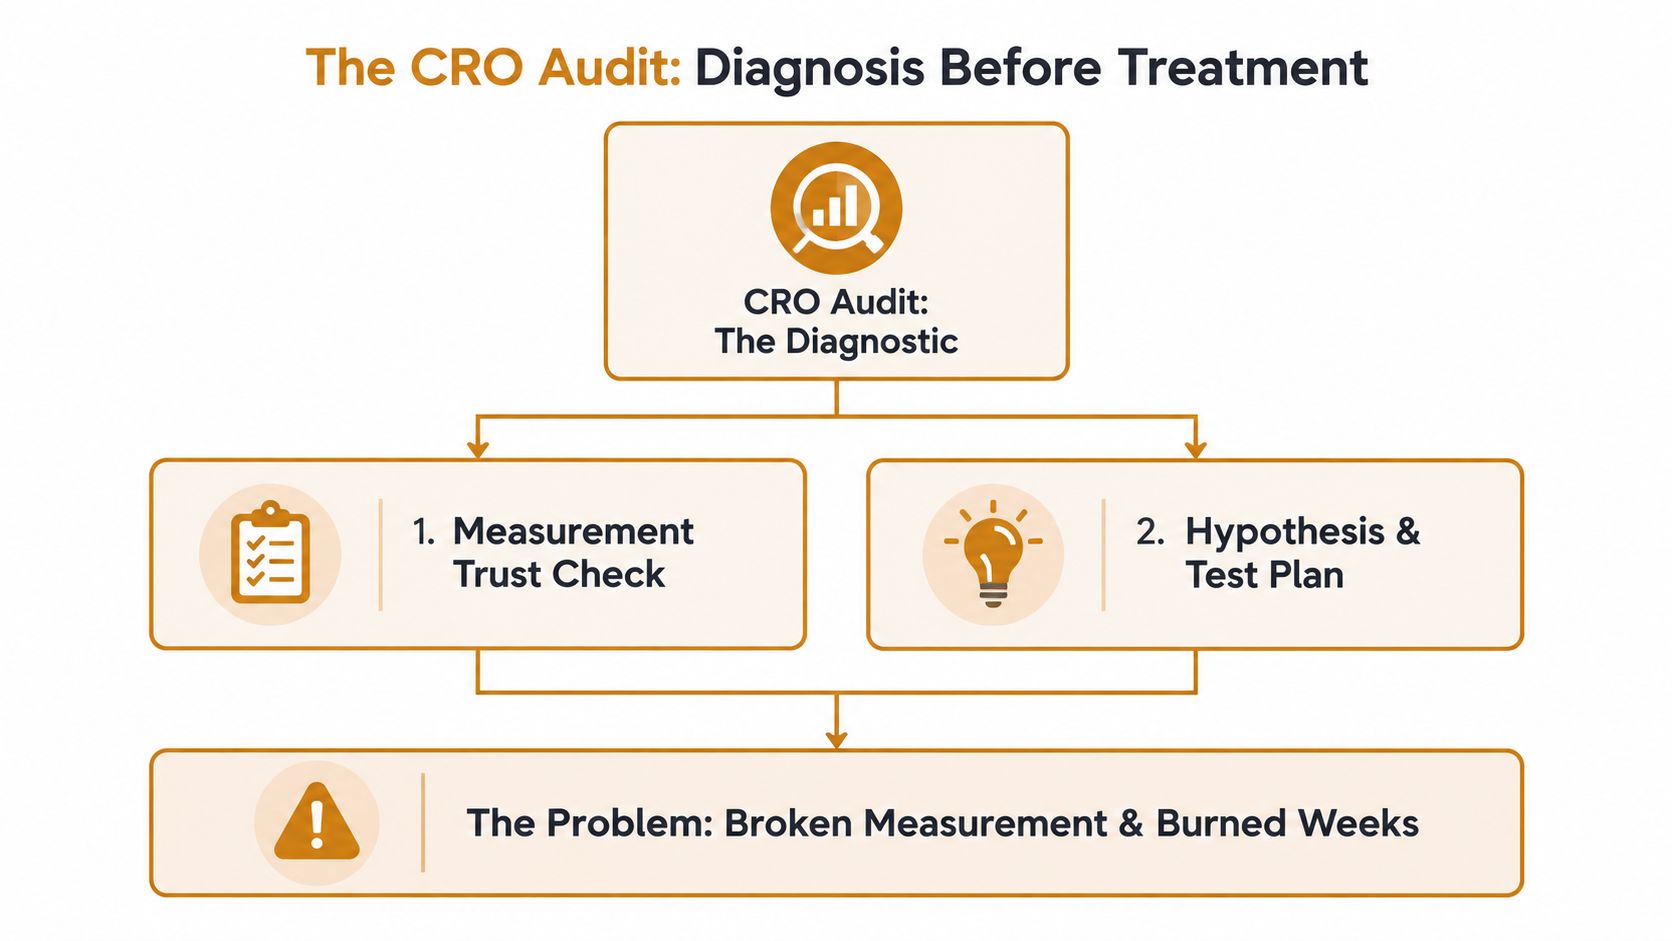
Most conversion rate optimisation audits fail before anyone reviews a headline. Teams test pages against duplicated events, missing consent signals, and blended traffic, then mistake dashboard noise for customer friction. A proper audit proves the measurement is trustworthy, maps the revenue leak, and ranks fixes by expected recovery per week of work, not by how many test ideas someone can list.
The popular answer is “review your UX and run A/B tests”. That’s incomplete. A CRO audit is a structured diagnostic that validates data, funnel behaviour, traffic quality, page experience, and test priorities before changes ship.
What a conversion rate optimisation audit actually is
A CRO audit can waste weeks if the measurement is unreliable. The scarce resource is not a list of hypotheses. It is confidence that the denominator, attribution, and conversion event support a commercial decision.
A conversion rate optimisation audit is a structured review that verifies measurement, locates funnel friction, assesses page experience, and ranks fixes by expected revenue recovery per week of work. It produces an operating plan, not a queue of button-colour ideas or a UX checklist separated from revenue.
The work runs across four layers:
- Analytics integrity, including event firing, consent state, bot and internal traffic exclusion, and reconciliation with operational records.
- Funnel and traffic mix, including source, campaign, device, landing page, and the point where users disappear.
- UX and page performance, including value proposition clarity, mobile behaviour, form friction, and load experience.
- Hypothesis ranking, ordering confirmed problems by expected recovery against implementation effort.
A useful audit should leave three concrete outputs. First, a measurement sign-off confirming that the dashboard is trustworthy enough to optimise from. Second, a ranked fix list showing the reasoning behind its order. Third, a test sequence that isolates each meaningful change and avoids spending a week measuring several changes at once.
Conversion performance is often modest, so small leaks can represent meaningful recovered revenue. That conclusion only holds when the dashboard identifies the leak accurately. A high-volume account can lose more from one broken event or misclassified campaign than from several visible page annoyances.
The practical method is set out in this CRO experimentation guide. Prove the measurement first, then rank the work by expected revenue recovered per week. Generate tests after that.
Check the measurement before you check the page
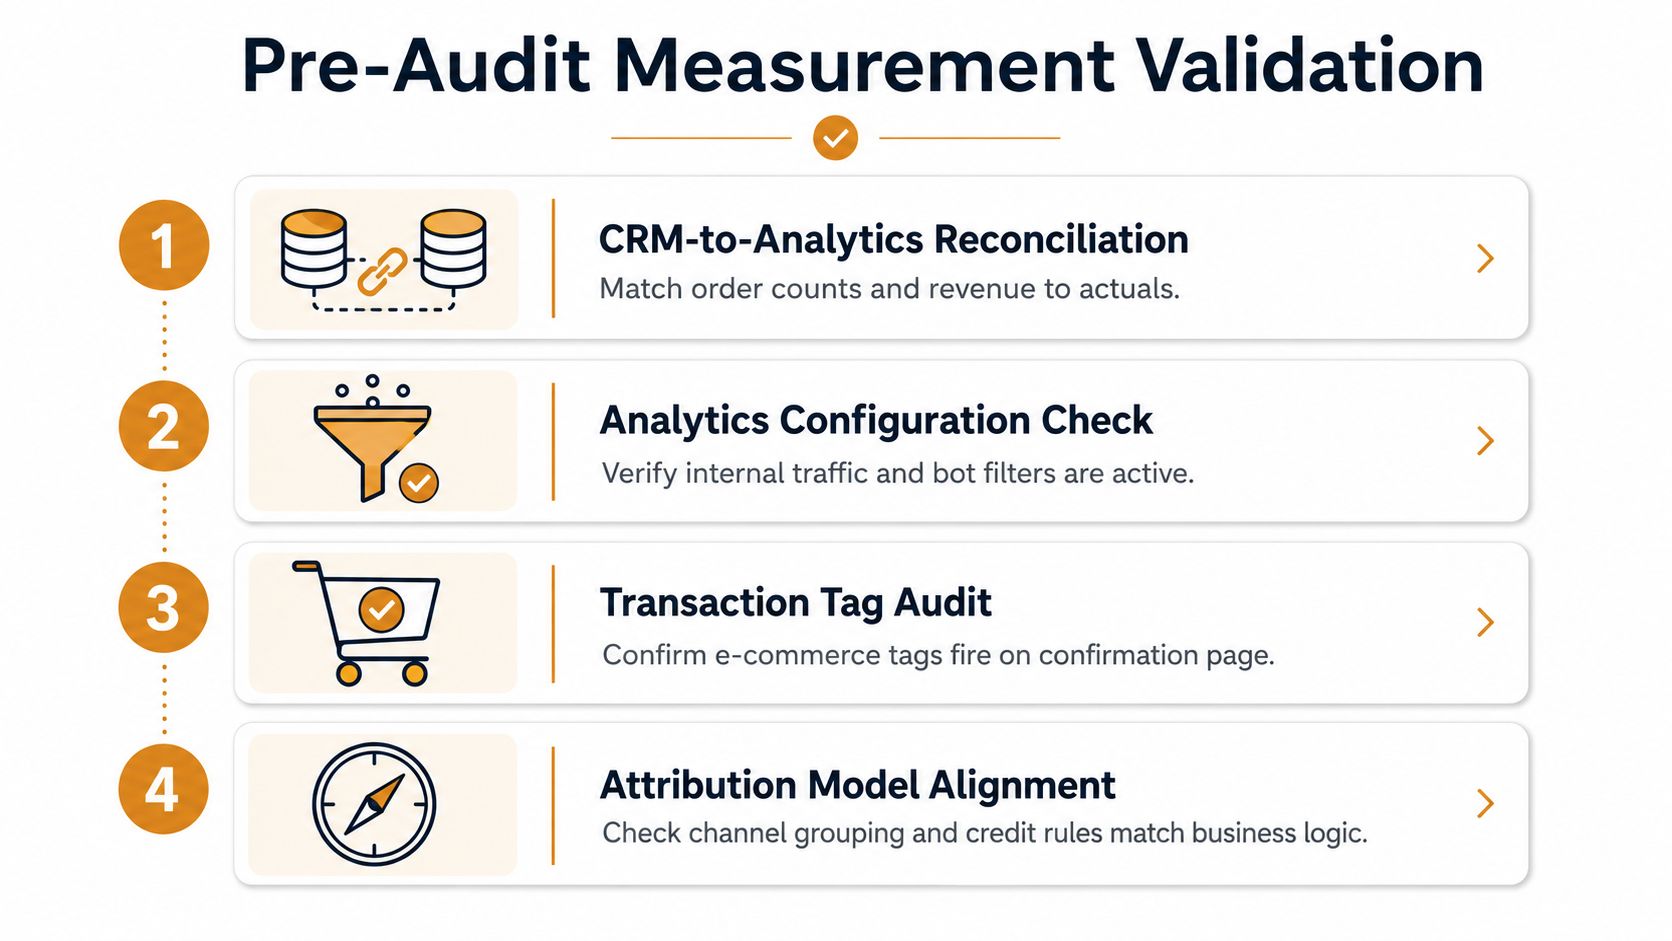
A page review is wasted if the dashboard counts the wrong conversion. Before opening a heatmap or rewriting a headline, prove that reported conversions reconcile with actual orders or qualified leads within about 5%. This threshold comes from UXCam’s CRO audit guidance. Until the measurement passes, every UX finding remains provisional.
Start with the operational truth
Run the reconciliation across the same date range, timezone, conversion definition, and source scope:
abs(analytics conversions - CRM conversions) / CRM conversions × 100
Run it separately for orders and qualified leads. An ecommerce business should compare recorded transactions and revenue with its order system. A lead-generation business should compare submitted conversions with accepted, deduplicated CRM records.
If the variance exceeds 5%, isolate the cause before optimisation. Typical causes include thank-you-page reloads, duplicate purchase events, offline lead imports, timezone mismatches, and consent-related signal loss. A small-looking reporting gap can redirect budget toward the wrong source or make a weak landing page appear harmless.
Check event mechanics in sequence
Use a test order or test lead, then inspect the complete journey:
- Event firing, confirm the conversion event fires on completion, not on a page view or button click.
- Event count, confirm one completion creates one conversion, even if the confirmation page reloads.
- Payload quality, check the event name, value, currency, order or lead identifier, and relevant product identifiers.
- Refund handling, confirm refunded transactions do not leave revenue reporting permanently overstated.
- Traffic exclusions, verify bot and internal traffic filters are active before judging engagement metrics.
- Consent state, check whether paid traffic is being placed in “other” or losing conversion attribution when consent is declined.
Server-side and browser events require a defined split. They should not fire independently for the same action. Shared event_id deduplication prevents one conversion from becoming two, particularly when server-assisted advertising measurement is involved. Check the tracking and pixel audit mechanics against each product page, cart, and purchase confirmation.
Practical rule: A page review cannot rescue a dashboard that counts the wrong conversion twice.
Record the sign-off
Create one measurement record containing the reconciliation result, event-test evidence, consent behaviour, exclusion settings, deduplication logic, and unresolved caveats. The audit does not move to the UX layer until that record is signed.
The same diagnosis-before-edits principle appears in this guide to auditing your own ad account. Use the measurement validation template above to record each pass or fail before a page review begins.
| Check | Pass condition | If it fails |
|---|---|---|
| CRM reconciliation | Variance within 5% | Stop optimisation and investigate |
| Conversion event | Fires once per completion | Fix event trigger |
| Consent state | Attribution behaviour is understood | Document and repair configuration |
| Traffic filters | Bot and internal traffic are excluded | Correct reporting views |
| Browser and server split | Shared identifiers prevent duplicates | Repair deduplication |
Measurement validation is not administration. It determines whether the account is eligible for optimisation. If the numbers fail reconciliation, the highest-value work may be repairing event logic or attribution rather than testing a page element. Only after the dashboard earns that trust should fixes be ranked by expected revenue recovered per week of work.
Map the funnel and the traffic mix behind it
A blended conversion rate is often the least useful number in the account. Map every step from visit to commercial outcome, then segment the result by source, campaign, landing page, and device. The aim is to prove where qualified demand is being lost before anyone edits the page.
For ecommerce, chart sessions, product views, add to cart, checkout starts, and purchases. For lead generation, use sessions, landing-page views, form starts, form completions, and qualified leads. Record both the percentage lost and the absolute users lost. A large percentage drop can represent less recoverable revenue than a smaller drop in a high-volume step.
| Funnel step | Healthy drop-off | Audit threshold | Action |
|---|---|---|---|
| Session to product or page view | Stable for the source | Material deterioration versus the source baseline | Check message match and landing experience |
| Product or page view to add to cart or form start | Consistent by device | Sharp source or device gap | Review intent, offer clarity, and CTA visibility |
| Add to cart or form start to checkout or completion | Limited friction | Disproportionate abandonment | Inspect costs, fields, errors, and trust |
| Checkout or completion to purchase or qualified lead | Clean completion path | Missing or duplicated completion events | Reconcile tracking before interpreting behaviour |
Keep paid and organic traffic separate. Branded search and returning users usually carry different intent from cold paid acquisition, so the blended rate can hide a weak acquisition path behind high-intent demand.
Apply the same discipline within paid traffic. Break out non-brand campaigns by match type, landing page, device, creative angle, and audience temperature. A low-converting source may be sending poor-quality traffic to a sound page. Another may send qualified visitors to a page that fails to deliver the promise made in the ad.
Show the money in the segment
Review conversion rate, bounce rate, exit rate, average session duration, click-through rate, and average order value together. Short sessions with a low conversion rate point toward an entry or message problem. Strong product-page engagement followed by checkout abandonment points to a later-stage issue.
Published conversion audit guidance notes that performance varies by business model, product, device, location, and conversion definition. Use benchmarks as context, not as a verdict. The useful comparison is your own segmented baseline and the revenue attached to each gap.
For teams managing meaningful paid budgets, start with paid non-brand by landing page and device. That view isolates expensive intent without letting strong organic demand disguise the loss. Rank the resulting segments by expected revenue recovery per week of work, then send only the highest-value diagnosis into the page review.
If the traffic diagnosis is mixed with media buying, review the paid social agency evaluation criteria before assigning a landing-page problem to the wrong operator. This separates traffic-quality issues from page issues and prevents testing from becoming a substitute for account diagnosis.
Score the UX, speed and form layer with real thresholds
Page reviews should use pass and fail conditions, not taste. A page can look polished and still fail because the proposition is buried, interaction is slow, checkout fields create friction, or mobile converts materially worse than desktop.
| Check | Pass threshold | Fail threshold | Diagnostic tool | False positive to ignore |
|---|---|---|---|---|
| UX clarity | Primary value proposition visible within 600px on desktop or 400px on mobile | Proposition is hidden below that area | Page capture and device review | A visually attractive hero with no clear outcome |
| LCP | At or below 2.5 seconds at the 75th percentile | Above 2.5 seconds | Field performance report | A fast lab test on a powerful desktop |
| INP | At or below 200ms at the 75th percentile | Above 200ms | Interaction performance data | A clean score with delayed third-party scripts |
| CLS | At or below 0.1 at the 75th percentile | Above 0.1 | Layout stability report | A stable page that shifts only after a user action |
| Form friction | No non-essential checkout field above the fold | Optional fields compete with completion | Form replay and field analytics | A short form that still shows vague errors |
| Guest checkout | Reachable within two clicks | Buried beyond two clicks | Manual journey test | A visible guest option that fails on mobile |
| Mobile parity | At least 60% of desktop conversion on the same source | Below 60% | Source and device report | Comparing different traffic mixes |
The performance thresholds above follow the field targets used in the official web performance guidance. The comparison matters because speed data without source and device context creates false alarms.
Separate blockers from preferences
Fix broken buttons, layout overlap, missing error messages, and payment failures without waiting for an experiment. Test claims, hierarchy, proof placement, and offer framing where the current experience works but may persuade better.
A form doesn’t need fewer fields because short forms are fashionable. Remove a field when it isn’t needed for fulfilment, qualification, routing, or compliance. Otherwise, you may improve completion while degrading lead quality or operational handling.
Mobile parity deserves a matched comparison. Don’t compare all mobile users with all desktop users, since their acquisition sources and intent can differ. Compare the same source, campaign group, and landing page across devices.
A practical experiment design lab should preserve these distinctions. The point isn’t to make every page score well. It’s to find the page-layer issue that can plausibly recover revenue.
Rank hypotheses by revenue recovered per week of work
The best hypothesis is not the most exciting one. Rank confirmed issues by expected revenue recovery per week, then discard work whose expected recovery doesn’t beat the cost of the people shipping it.
Use this formula:
(monthly traffic × current conversion rate × forecasted lift × average order value) ÷ estimated weeks to ship
The forecasted lift must be written as a percentage-point change when the estimate is expressed that way. Keep confidence and effort beside the calculation, because a high upside with weak evidence can still deserve less attention than a smaller, well-supported fix.
Worked ecommerce example
The following scenario is a planning example, not a reported case study:
- Monthly sessions: 100,000
- Current conversion rate: 1.8%
- Average order value: £85
- Checkout simplification forecast: 0.4 percentage-point lift
- Checkout effort: two weeks
The estimated additional orders are:
100,000 × 0.004 = 400 orders per month
Estimated monthly revenue recovery is:
400 × £85 = £34,000 per month
Dividing that by two weeks gives £17,000 per week of work, not £68,000 per month or £34,000 per week. The arithmetic matters. A forecasted percentage-point lift applied to total sessions produces 400 additional orders, and the stated effort changes the ranking.
For a hero copy rewrite:
- Forecasted lift: 0.1 percentage point
- Effort: one week
100,000 × 0.001 × £85 = £8,500 per month
That becomes £8,500 per week of work because the work is estimated at one week. The checkout change ranks first under this corrected calculation, although its medium confidence should still be recorded.
Add confidence before committing capacity
Use a simple table:
| Hypothesis | Forecast lift | Confidence | Effort | Recovery per week |
|---|---|---|---|---|
| Checkout simplification | 0.4 percentage points | Medium | Two weeks | £17,000 |
| Hero copy rewrite | 0.1 percentage point | High | One week | £8,500 |
These are forecast figures, not guaranteed returns. Reject any item where expected weekly recovery doesn’t beat the engineer or strategist cost of shipping and validating it.
Many prioritisation matrices fail. They score “impact” as high because the idea sounds obvious, then ignore implementation time, traffic eligibility, margin, fulfilment limits, and evidence quality.
For a more grounded resource decision, use the agency versus in-house cost maths alongside the recovery forecast. The ranking should answer one question, which fix deserves scarce delivery time next.
Run tests one at a time and read the result properly
Sequential tests beat simultaneous redesigns when attribution matters. Change the hero copy, button colour, checkout fields, and mobile layout in one release and a lift tells you only that the bundle moved the result. It doesn’t tell you which change worked, whether one masked another, or what to retain.
A sequential test isolates cause. Run one material change against a stable control, preserve the conversion definition, and record the eligible audience before interpreting the result.
The example below uses a 5% baseline conversion rate, 50,000 sessions per arm, 95% confidence, and 80% power. Under those assumptions, the minimum detectable relative lift is about 4.6%, and the stated operating estimate is roughly two weeks per variant. A result below that detectable boundary should be treated as inconclusive, not promoted as a win.
| Test choice | What you learn | Main trade-off |
|---|---|---|
| One material change | Cleaner causal read | Slower release of bundled changes |
| Several changes together | Whether the bundle works | Attribution is lost |
| Small audience slice | Lower exposure risk | Longer time to useful evidence |
| Broad eligible audience | Faster evidence collection | Greater downside if the variant harms conversion |
Don’t confuse confidence with business importance
A statistically persuasive result can still be commercially weak if it affects low-value traffic or a small funnel step. Conversely, a valuable checkout test may need careful audience rules because purchase volume is lower than page-view volume.
Write the decision rule before launch:
- Primary metric, purchase or qualified lead completion.
- Guardrails, average order value, lead quality, refund rate, and revenue per session.
- Minimum detectable effect, the smallest change worth acting on.
- Stop rule, what ends the test and what doesn’t.
- Ownership, who can approve a fix, reject it, or request a rerun.
Don’t call a winner after a convenient early spike. Run the planned exposure, inspect source and device splits, and check whether tracking remained stable throughout the test. Then reproduce the winner in two consecutive tests before making it the permanent experience.
This position is less glamorous than shipping a full redesign. It is also more useful. A clean negative result saves future teams from repeating an attractive but unproven idea.
When to re-audit and the one thing to do tomorrow
A CRO audit belongs on the operating calendar and in the incident process. Stable sites need a full review every 6 to 12 months, with a focused measurement and funnel review each quarter, consistent with the cadence outlined in this guide.
Use a full 11-check audit every six months for a stable site. Low-traffic accounts can use a full review every twelve months, while quarterly checks stay focused on the measurement stack and core funnel metrics. The goal is not to generate another backlog of test ideas. It is to confirm that the dashboard is trustworthy, then rank fixes by expected revenue recovery per week of work.
Trigger an earlier review after unexplained performance movement, tracking changes, or a material journey break:
| Cadence or trigger | Scope of review | When it fires |
|---|---|---|
| Full review | Measurement, traffic, funnel, UX, speed, forms, mobile, research, prioritisation, testing, reporting | Every 6 months for stable sites |
| Full review for low traffic | Same diagnostic, with careful interpretation of sparse segments | Every 12 months |
| Focused quarterly review | Measurement stack and funnel metrics | Every quarter |
| CAC trigger | Attribution, traffic quality, landing pages, and funnel | Blended CAC rises more than 20% week on week without a media change |
| Checkout trigger | Checkout events, errors, payment flow, and device splits | Completion drops more than 15% |
| Instrumentation trigger | Event firing, consent, deduplication, and CRM reconciliation | A new analytics or CRM container ships |
| Site trigger | Redirects, templates, forms, speed, and tracking | A migration lands |
| Privacy trigger | Signal loss and attribution interpretation | Platform privacy updates alter tracking granularity |
The morning after an unexplained change, pull the last 30 days of conversion data by traffic source. Compare each source’s CVR with its 6-month median, then flag the weakest source for diagnosis before anyone writes a test brief.
That action stops a blended average from choosing the roadmap. It also exposes whether the apparent problem is measurement failure, traffic quality, or a real funnel leak. Fixing the wrong layer can consume a week while leaving revenue recovery untouched.
[[C11-OPTIN]]
Crank11 helps paid-acquisition teams verify tracking, find funnel leaks and turn CRO findings into ranked experiments through Crank 11. Visit the site to see how senior operators combine ad account diagnosis, funnel work and structured testing for brands already spending at scale.
Quick answers
What is a conversion rate optimisation audit?
It’s a structured diagnostic of measurement integrity, traffic, funnel behaviour, page experience, and prioritised fixes. It should produce a measurement sign-off, ranked revenue maths, and a test sequence, not a generic list of ideas.
How often should a CRO audit run?
Run a full audit every 6 to 12 months, depending on site stability and traffic volume, with a focused measurement and funnel review each quarter. Re-audit sooner after migrations, tracking changes, unexplained CAC movement, or checkout deterioration.
What should be checked first?
Reconcile analytics conversions with CRM or order records. A variance above about 5% means the dashboard needs investigation before page optimisation begins, because every downstream conclusion may be distorted.
Should every CRO change be A/B tested?
No. Broken forms, duplicate events, mobile layout failures, and payment errors should be fixed directly. Test persuasive changes where the existing experience works and the causal impact needs validation.
How should CRO work be prioritised?
Use expected revenue recovery per week of work, then adjust for confidence, margin, implementation effort, and operational constraints. A clever idea with weak economics belongs behind a dull fix with a credible recovery forecast.
[[C11-OPTIN]]
Tomorrow, reconcile the last 30 days by source against the six-month median and investigate the weakest segment before briefing a test. The CRO playbook gives you the operating sequence.