A 6.6% median landing page conversion rate is a useful baseline, not a verdict. Landing page conversion rate optimization means improving the percentage of paid clicks that complete a valuable action, while separating page friction from weak traffic, poor message match and an unconvincing offer. For brands spending $30k+ monthly, the best gains usually come from diagnosis and controlled testing, not another cosmetic redesign.
The obvious answer is “shorten the form and change the button”. That’s incomplete. A page can convert badly because the ad attracts the wrong intent, the offer lacks proof, or the page breaks on mobile. Fixing the wrong layer just gives you a prettier leak.
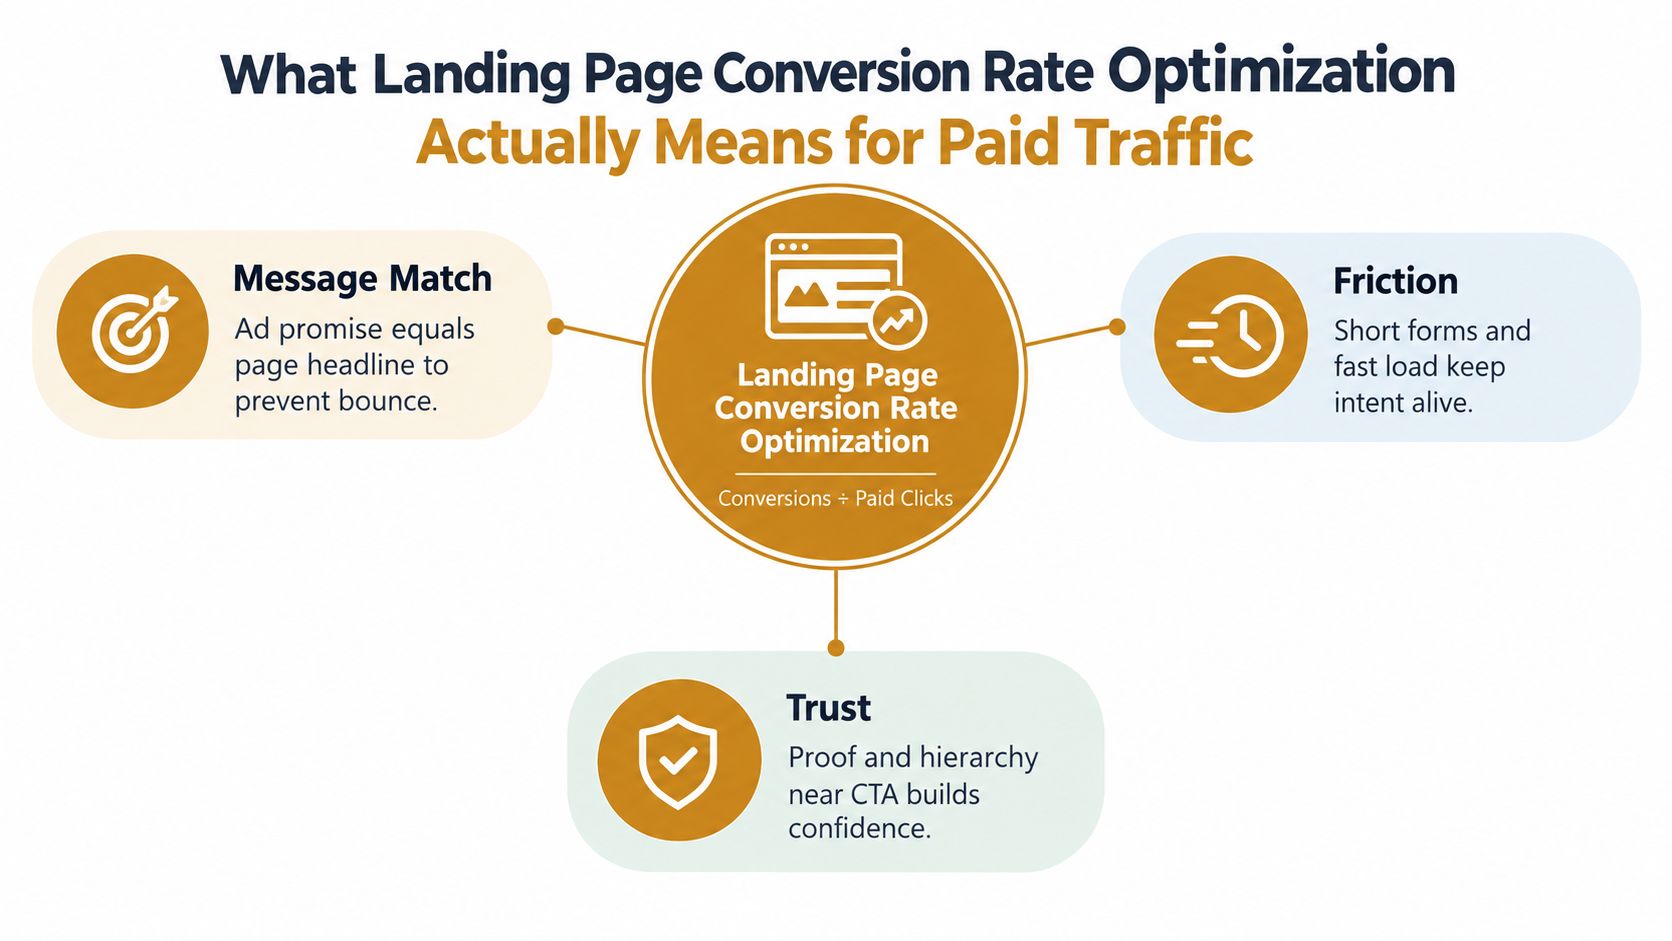
What Landing Page Conversion Rate Optimization Actually Means for Paid Traffic
Landing page conversion rate optimization is a revenue discipline. It improves the number of paid clicks that complete a valuable action, while testing whether the constraint sits in the page, traffic, offer or measurement. For ecommerce and lead-generation funnels, every visitor has an acquisition cost, so a higher conversion rate matters only when it improves qualified volume and downstream revenue.
A 2024 benchmark analysed 41,000 landing pages, 464 million visitors and 57 million conversions, reporting a 6.6% median conversion rate across industries. It also found that strong pages can reach 10% or more, while highly optimised pages in favourable conditions can reach 15% to 20%, particularly with warm or tightly targeted traffic, as detailed in the 2024 landing page benchmark analysis.
Use that benchmark as a reference point, not a target to copy. A paid-search visitor looking for a named solution has different intent from a cold social visitor encountering a new category. A demo request also has a different conversion ceiling from a product purchase.
The first operating rule is simple: segment conversion rate by source, campaign, device, offer and page type before writing a hypothesis.
Paid-traffic CRO has three jobs:
- Protect intent. The headline and hero should continue the promise made in the ad.
- Remove friction. Forms, load sequence, checkout steps and competing exits should not interrupt a ready buyer.
- Resolve doubt. Proof, guarantees, product detail and clear next steps should answer hesitation at the point it appears.
The page is one part of the acquisition system. A weak result can come from low-quality clicks, broken message match, an offer with poor economics or a page that fails on mobile. Diagnose those layers separately before spending development time on a redesign.
Crank11 operators review the ad, audience, click quality, page experience and downstream revenue together. Founders assessing external support can use how to evaluate a paid social agency to judge whether an agency can separate traffic diagnosis from page execution.
The scope stays narrow: a paid-traffic CRO operating system that identifies whether to change the ad, page, offer or measurement before increasing budget. It is not a broad SEO programme, full site rebuild or brand-positioning exercise.
How to Generate and Prioritise Hypotheses That Move Revenue
The best hypothesis backlog comes from evidence in three places, the ad-to-page transition, the page itself and the commercial outcome. Start there, then rank each idea by expected impact, confidence and effort.
Build the backlog from observed failure
First, compare the ad promise with the first screen of the destination page. If the ad says “same-day quote” and the page opens with a vague brand statement, the problem is message match. If the ad promotes a specific product bundle and the page sends visitors to a broad collection, the problem is intent continuity.
Second, inspect proof. Buyers need answers to different doubts depending on the offer. Ecommerce visitors may need delivery, returns, product quality or usage evidence. Lead buyers may need fit, implementation confidence, commercial clarity or a reason to submit their details now.
Third, inspect friction. Look for slow rendering, intrusive pop-ups, excessive fields, unclear errors, multiple competing CTAs and mobile layouts that hide the action. A form with about 3 fields has been associated with roughly 50% higher conversions than forms with many fields in benchmark summaries, though the trade-off is lower qualification depth, as reported in the landing page statistics review.
Use a simple scoring model:
Priority score = expected impact × confidence ÷ effort
Score each input from 1 to 5. Don’t pretend the score is scientific. Its job is to stop the loudest stakeholder from choosing the test.
| Hypothesis | Expected Lift | Confidence | Effort |
|---|---|---|---|
| Match headline to the winning ad hook | 5 | 5 | 1 |
| Move relevant proof beside the CTA | 4 | 4 | 2 |
| Reduce form to essential qualification fields | 4 | 3 | 2 |
| Replace the full page design | 5 | 2 | 5 |
The first row scores 25, the second 8, and the third 6. The redesign scores 2, despite appearing more ambitious. That’s the point. Large projects often carry more uncertainty and hide which change caused the outcome.
Work the commercial maths
Assume 10,000 paid clicks in 30 days, a £60 cost per click, and a baseline conversion rate of 6.6%. The spend is £600,000, producing 660 conversions, so paid acquisition cost per conversion is £909.09.
If the page reaches 8%, the same traffic produces 800 conversions. CPA becomes £750, a reduction of £159.09 per conversion, while the media spend and click volume stay fixed. If conversion value is £1,500 per conversion, revenue rises from £990,000 to £1,200,000, and ROAS moves from 1.65x to 2.00x.
That calculation doesn’t prove the test will win. It shows why page work deserves a seat beside media buying. Before changing audiences or raising bids, calculate the value of improving the denominator you already paid to acquire.
For diagnosis, use our account audit process to check whether weak conversion is being caused upstream by audience, creative or campaign structure. A page test can’t rescue traffic with no buying intent.
How to Design Tests That Produce a Real Winner
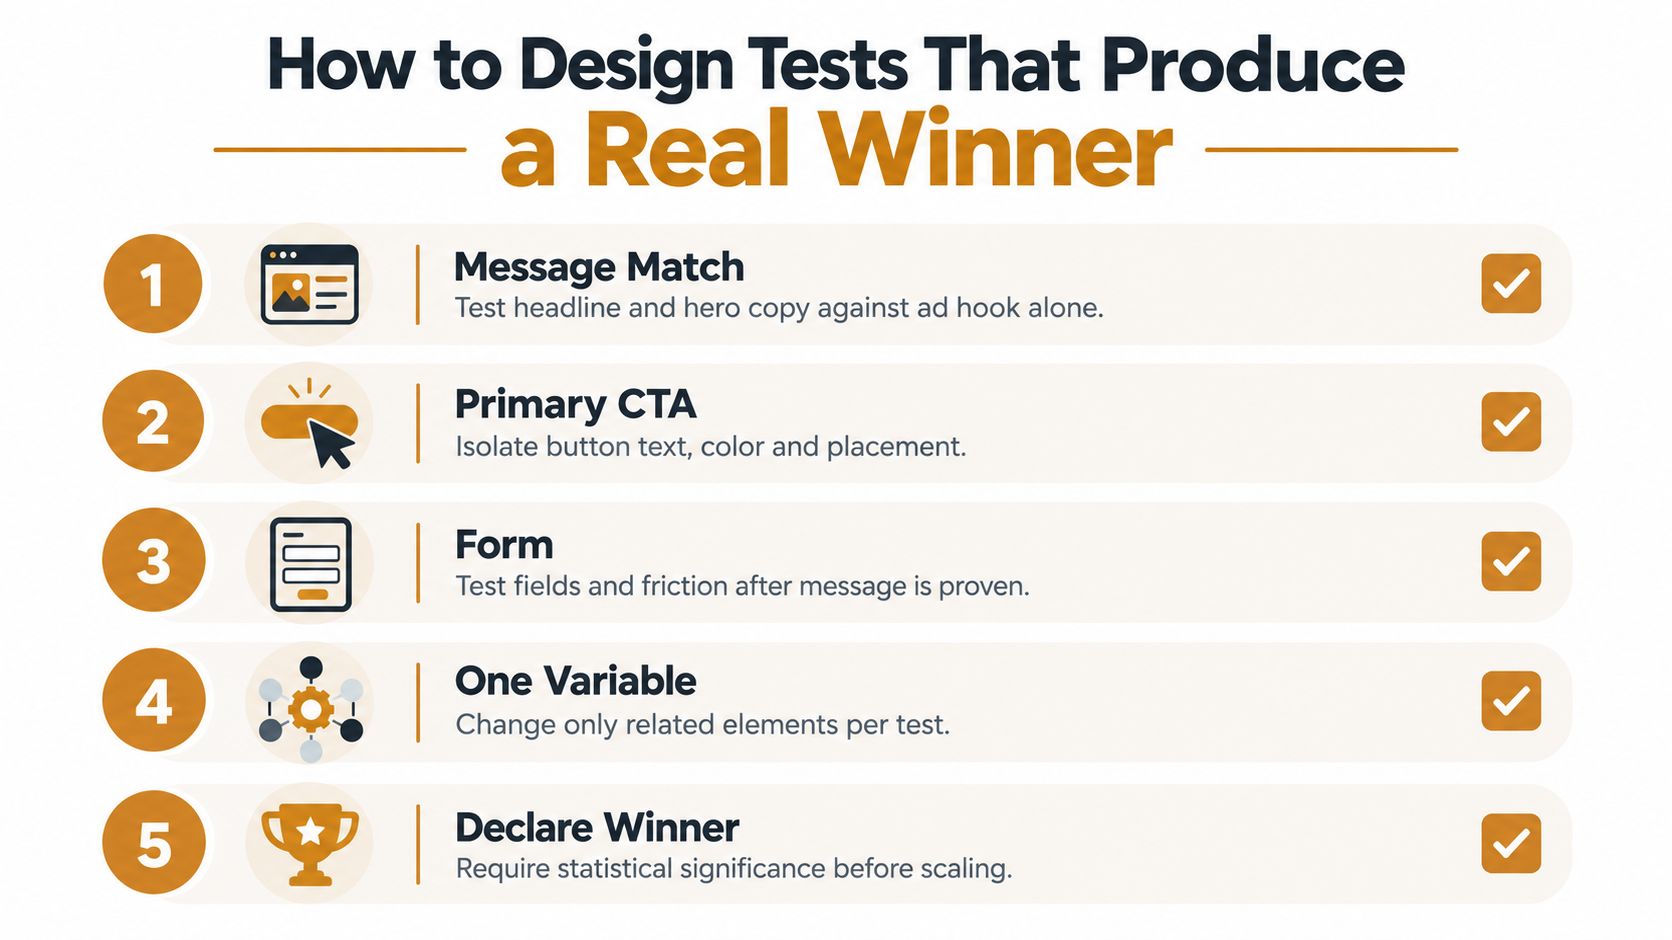
A real winner comes from a controlled sequence, not a full redesign launched with six changes and a congratulatory screenshot. Test the largest uncertainty first, isolate related variables and define the decision rule before traffic enters the experiment.
Use a fixed testing order
Start with headline and hero copy against the ad hook. This is the most important question because visitors decide whether the page is relevant before they study the proof or form.
Next, test the primary CTA. Change the action language, placement or surrounding reassurance, but don’t rewrite the page at the same time. Then test form length and field order. Social proof comes after the basic promise and action path are credible.
A page redesign is tempting because it feels decisive. It’s usually poor learning. If conversion rises, you won’t know whether the headline, offer framing, speed improvement or visual hierarchy did the work. If conversion falls, you’ll have a large rollback and no clean lesson.
Set the rules before launch
Use this test checklist:
- Name the primary conversion. Ecommerce teams should use completed orders or an agreed qualified action, not a softer click that can rise while revenue falls.
- Choose one variable cluster. Headline and supporting hero copy belong together. Form fields and validation behaviour may belong together. A new hero image and a new CTA don’t.
- Define the minimum detectable effect. Decide what lift would justify implementation before seeing results. A tiny movement may not cover engineering, creative or operational cost.
- Protect the control. Keep a stable control version so the result has a reference, and preserve a holdout where the business needs to measure longer-term impact.
- Require statistical significance. A variant that wins early on low traffic is a candidate, not a winner.
The exact sample requirement depends on baseline rate, traffic volume, allocation and the minimum effect worth acting on. Low-traffic pages shouldn’t be forced into endless A/B tests. Use a qualitative review, a sequential holdout or a larger page-level change only when the expected learning justifies the uncertainty.
Our experiment lab is built around this type of controlled iteration. The operating principle is simple, ship one meaningful question, record the result, then decide whether the next test should attack message, friction or proof.
Don’t stop because a dashboard displays a green badge. Check conversion quality, lead qualification, revenue per visitor and downstream close rate. A form variant can generate more names while making sales worse.
Creative and Copy Treatments That Hold Message Match on Mobile
A paid visitor should recognise the clicked promise in the first screen, understand the next action and find enough proof to continue. Specificity does that better than polish.
A weak headline says, “Better solutions for modern teams.” A stronger treatment says, “Turn paid clicks into qualified pipeline without adding sales headcount.” It names the outcome and the pain, giving the ad team a clear message to carry through the page.
For ecommerce, lead with the product or offer shown in the ad. “A daily electrolyte mix for long training sessions” gives a visitor more direction than “Feel your best every day.” For lead generation, name the audience and mechanism. “Book a warehouse efficiency review” is more concrete than “Improve your operations”.
Treat mobile as the primary layout
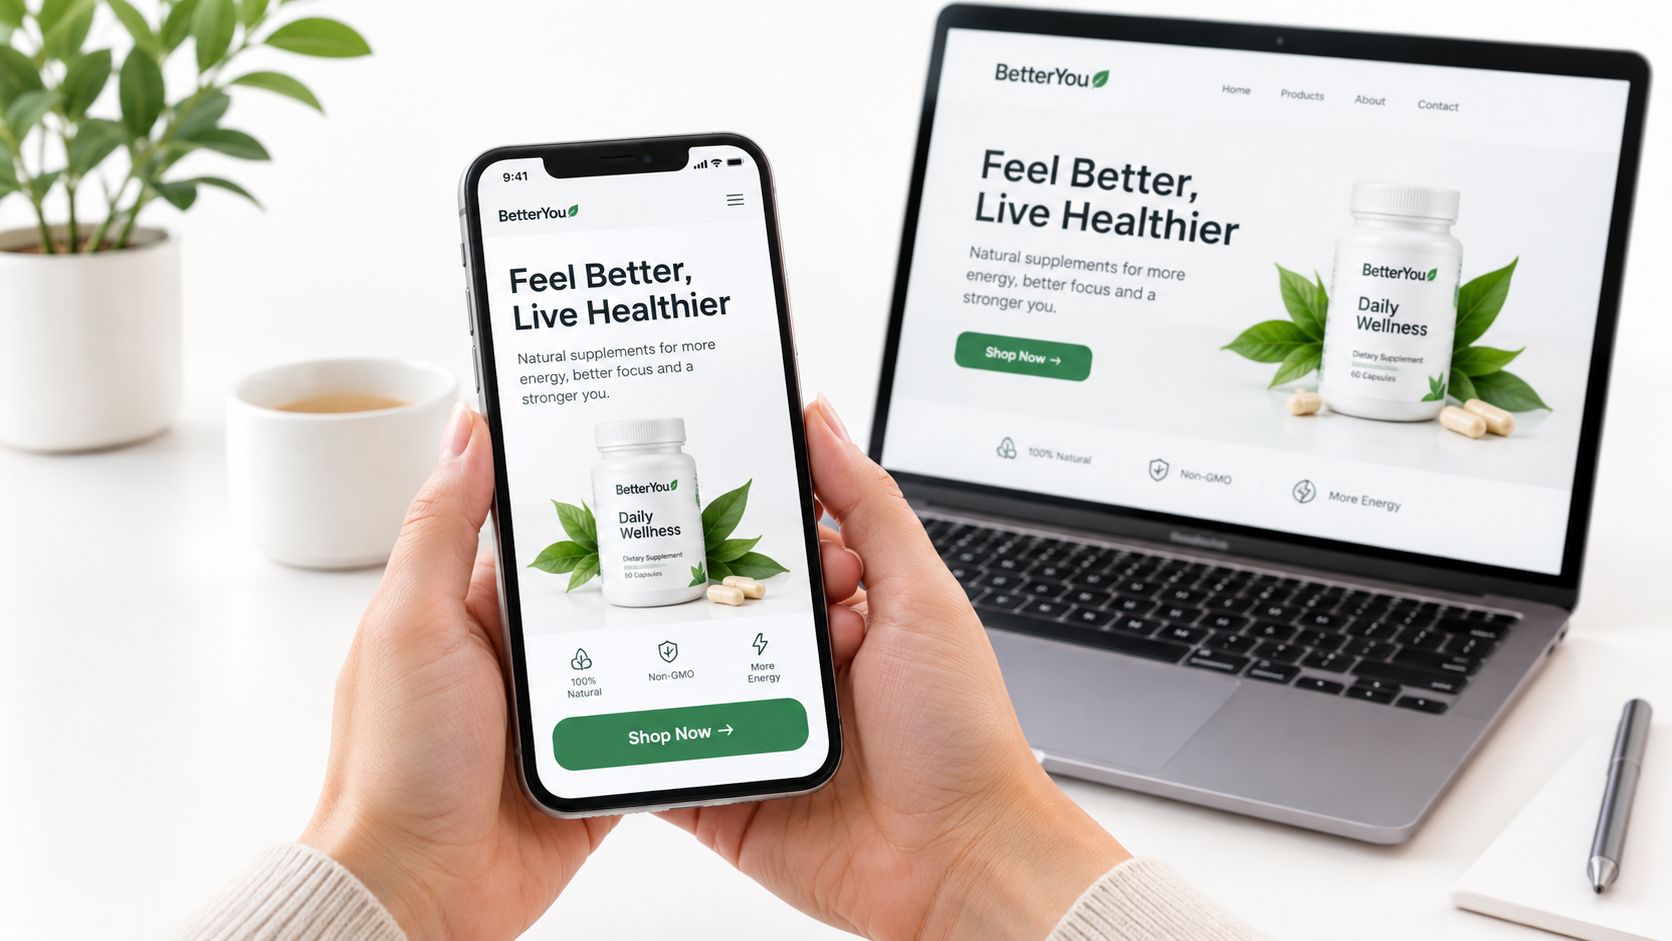
Mobile traffic deserves the first design decision, not a late responsive adjustment. Put the promise, product or offer, primary CTA and most relevant reassurance in the first viewport. If the action is hidden below decorative content, visitors must do extra work before they can act.
Keep the first interaction light. Compress media, prevent layout shifts and make the button easy to tap. Check the rendered page on the devices receiving paid traffic, because a desktop review will miss cramped fields, wrapped headlines and sticky elements that cover the CTA.
AI-assisted production adds a copy risk. Generic headlines can make pages sound interchangeable, especially when competing pages repeat language such as “discover”, “transform” and “better way”. Use AI to produce variations and scoring inputs, then force the final copy through customer language, objection logs, search terms and actual product detail.
Personalise by intent only when the traffic signal supports a distinct promise. Otherwise, keep one sharp control rather than several diluted pages that each say something slightly different. Our experience with paid ad fatigue and creative wear-out supports the same operating rule. Fresh creative helps, but freshness without message continuity wastes paid clicks.
What Tracking and Analytics Setup Makes Results Trustworthy
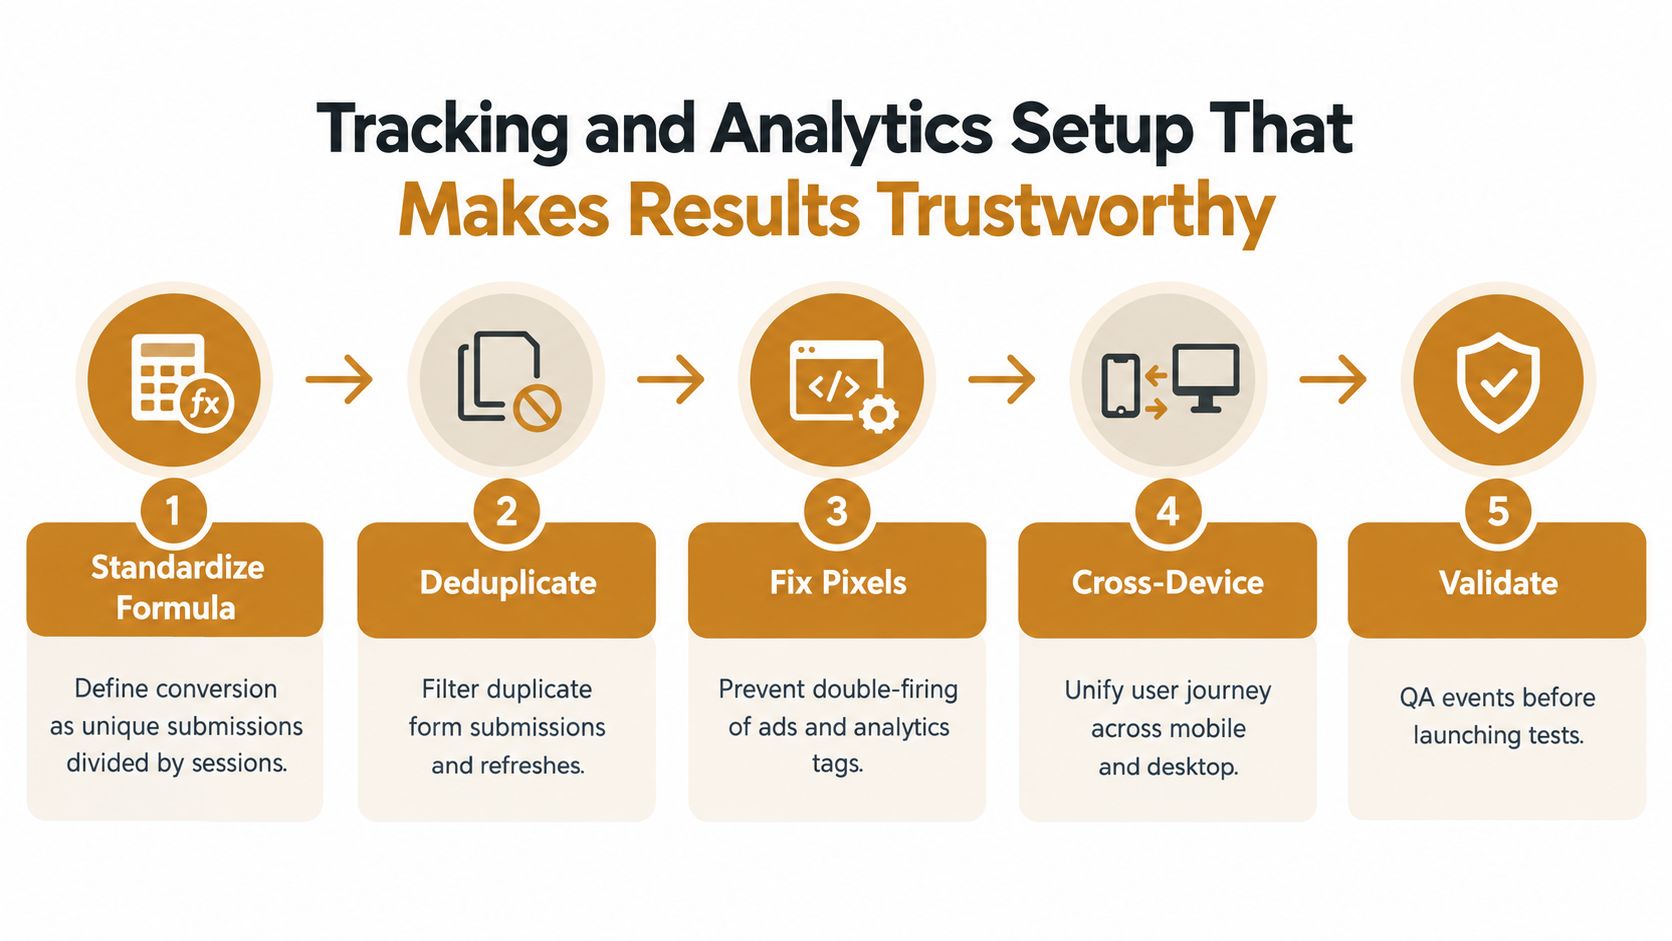
A test is only credible when its denominator, event logic and business outcome agree. Standardise the conversion formula, remove duplicate events, reconcile reported conversions with backend records and isolate speed effects before assigning credit to copy.
Fix the measurement layer first
Use one primary page rate:
Conversion rate = unique completed conversions ÷ qualified paid sessions × 100
Document whether the denominator uses sessions, visitors or clicks. Keep that choice consistent across reports. Record the attribution window, date range, page version and business event that qualifies as a conversion.
Run these checks before launch:
- Deduplicate submissions. Exclude refreshes, repeated clicks and duplicate form events.
- Stop double firing. Confirm each advertising and analytics event fires once for its intended action.
- Reconcile outcomes. Compare reported conversions with unique orders, accepted leads or qualified sales records.
- Segment devices. Review mobile and desktop separately, then check whether cross-device journeys distort the result.
- QA the event. Submit a test, inspect the event, confirm the thank-you state and verify the backend record.
An industry benchmark covering 41,000+ landing pages, 464 million visitors and 57 million conversions reported a 6.6% median conversion rate, as shown in the Q4 2024 conversion benchmark. Treat that figure as context, not a target. A blended rate can hide a strong warm audience beside weak prospecting traffic, so segment by campaign, audience, device and landing page before making a decision.
Test speed before persuasion
Historical research reports that pages loading in 1 second can convert about 3 times better than pages taking 5 seconds, while a 1-second delay can reduce conversions by roughly 7%, as summarised in the historical landing page speed findings. Separate mobile research reported that a 0.1-second speed improvement lifted retail conversions by 8.4% across 37 brand sites and more than 30 million sessions, according to the mobile speed research summary.
The testing implication is direct. If version B loads faster, its copy may receive credit for a technical improvement. Keep performance conditions consistent where possible, record load metrics beside conversion data and avoid running a copy test while one variant carries heavier scripts or media.
For paid-account diagnosis, this account audit findings note helps separate tracking defects from creative and landing-page problems. Fix the evidence first. Then optimise the story.
How to Roll Out Winners and Measure the Commercial Result
A winning page variant is the start of rollout, not the end of the test. Compare it with a holdout where possible, then judge the change using CAC, MER, revenue quality and lead quality alongside the landing page conversion rate.
Use a rollout ladder
Move a confirmed winner through four controlled stages:
- Controlled exposure. Keep the original control live and monitor the primary conversion with guardrail metrics.
- Broader traffic. Expand the winner across relevant campaigns and audiences. Do not assume one result transfers everywhere.
- Holdout review. Retain a stable comparison group when traffic volume and operations make that practical.
- Rollback readiness. Keep the previous page, tracking setup and change log available until downstream results settle.
A higher page rate can still produce worse commercial efficiency. A shorter lead form may increase enquiries while reducing qualification. A stronger product-page offer may raise orders while lowering average order value. Report the immediate page result and the business result separately.
A practical 30-day experiment queue
Days 1 to 5 cover tracking QA, page-speed checks, source segmentation and qualitative review. Do not redesign yet. Establish the baseline and locate the largest unexplained drop.
Days 6 to 15 test the highest-confidence message-match change. Keep audience, offer, pricing and measurement fixed. Compare the result with the predefined minimum effect, rather than a convenient daily snapshot.
Days 16 to 23 test the primary CTA or clearest friction point, such as an unnecessary form field or competing exit. If the first test is inconclusive, wait for a decision before stacking another test on top.
Days 24 to 30 validate the strongest version across the traffic mix that matters commercially. Check lead acceptance, completed purchases, CPA and revenue per paid session.
For a 90-day roadmap, repeat the cycle with proof structure, mobile interaction and offer-specific pages. Assign one owner to the hypothesis, another to implementation and one person to commercial sign-off. An unowned backlog is only a wish list.
Quick answers
What is a good landing page conversion rate?
The 2024 median was 6.6% across industries, based on 41,000 landing pages, 464 million visitors and 57 million conversions, according to the Genesys Growth benchmark summary. Treat that figure as a reference. Segment by source, device, offer and page type before setting a target.
Should I fix traffic or the page first?
Check message match, visitor intent and downstream quality before changing the page. An irrelevant ad promise creates an acquisition problem that page CRO cannot repair. Qualified traffic with a broken first screen points to a page problem.
Should I shorten every form?
No. Remove fields that do not affect qualification, but keep information required by sales or fulfilment. A shorter form can increase volume and reduce lead quality, so judge it by accepted or closed outcomes.
How fast should a landing page load?
As quickly as practical, especially on mobile. Research has found that pages loading in 1 second can convert about 3 times better than pages taking 5 seconds, so speed belongs in the first diagnostic pass, as documented in the speed benchmark summary.
Should I redesign the whole page?
Usually not. Start with the highest-confidence message, friction or proof hypothesis. A full redesign can create movement, but it removes causality and makes the next decision harder.
[[C11-OPTIN]]
Tomorrow morning, standardise the conversion denominator, segment paid traffic by intent and test the clearest ad-to-page message match first. Use the Crank11 landing page CRO playbook to turn the result into a documented experiment queue.