Winning Creatives Ads programmes at scale produce 12 to 19+ new creatives per week for top spend tiers, with only 5% to 8% becoming winners. That means intuition is a poor production system. You need enough distinct concepts to create a reliable hit rate, then a ruthless process for scoring, testing and retiring them.
A polished “hero ad” won’t save an account that has stopped supplying fresh ideas. At scale, creative volume beats creative instinct, provided distribution and testing remain disciplined.
Why Most Creatives Ads Programmes Lose Before They Start
At scale, creative intuition is an unreliable production system. A 2026 benchmark covering nearly 600,000 ads from 6,015 advertisers found that only 5% to 8% became winners. Creative output is therefore a statistical requirement, not a mood board exercise. The benchmark’s findings are blunt. Most concepts will fail, so the account needs enough distinct attempts to find the few worth scaling.
The commercial case is stronger than creative preference. Industry reporting attributed 49% of incremental sales lift to creative, exceeding reach, targeting, recency and brand equity combined. The industry analysis of creative-driven sales lift supports treating creative as a first-class performance input, not decoration added after media planning.
Volume does not earn every asset a budget. It gives the team enough shots to identify useful ideas, provided scoring, testing and retirement remain disciplined.
Your weekly replacement rate
The same 2026 benchmark reported 6 to 7 creatives shipped per week for median advertisers, compared with 12 to 19+ for the top spend tier. It also reported 10 winners per month for top-quartile enterprise teams versus 4 winners for the average enterprise account. The benchmark data gives senior buyers a defensible starting point: set an output target before debating taste.
Here is the operating maths. A team shipping 10 concepts in a month with a 3% winner rate should expect:
10 × 0.03 = 0.3 winners per month.
That is a winner drought with better branding. If the account needs two fresh winners monthly to replace fatigue, production must reach roughly 67 concepts, because 67 × 0.03 = 2.01 expected winners. The input is hypothetical, but the calculation exposes the operational constraint. Low volume leaves too little room for a low hit rate.
| Benchmark measure | Creatives shipped per week | Winners per month |
|---|---|---|
| Median advertiser | 6 to 7 | Not specified |
| Top spend tier | 12 to 19+ | Not specified |
| Average enterprise account | Not specified | 4 |
| Top-quartile enterprise team | Not specified | 10 |
The full benchmark separates shipping velocity from winner output because they are different KPIs. An account can ship constantly and still produce too few winners. Track both measures, then investigate the gap between them.
The position we take
Ship more, score ruthlessly and retire faster. A creative lead cannot reliably identify the next winner from a handful of options. Give the system enough concepts to produce a meaningful signal, then stop protecting weak ads because someone likes the edit.
Fatigue follows an operational pattern. Teams that keep one tired angle live while waiting for inspiration accept declining efficiency. Our notes on why ads fatigue explain the failure behind that pattern.
A weekly dashboard should show concepts briefed, concepts shipped, concepts passing pre-launch, tests completed, winners promoted and losers retired. Blank fields expose a broken production system.
Use this target: ship at least 12 new concepts weekly in a scaled account, then increase it if the winner pipeline remains thin. The target can change. The feedback loop cannot.
The weekly creative capacity dashboard
Track capacity, replacement rate and winner output in one view. That turns “we need more ads” from a recurring complaint into a measurable weekly operating decision.
[[C11-OPTIN]]
The Production Workflow That Hits a One-Day Turnaround
A one-day turnaround comes from removing hand-off delays, not asking people to work recklessly. The workflow needs one owner for the brief, one senior reviewer for quality and a fixed path from concept to upload.
Crank11-style production works as a compact weekly pipeline. The same structure works in-house if responsibilities are explicit.
Monday, build the concept queue
The media buyer supplies fatigue signals, spend concentration, CPA movement, placement breakdowns and winning message patterns. The strategist turns those inputs into 12 or more distinct concepts, not twelve headline rewrites.
Each brief contains the audience tension, promise, proof point, offer, hook, format, placement and disallowed claims. AI-assisted drafting can produce first-pass hooks, scripts and copy variants, but a human operator owns the angle.
Tuesday, score and make
A creative producer turns approved concepts into placement-native assets. For Meta, that usually means vertical short-form video, UGC-style footage, static product demonstrations, carousels and offer-led graphics. For Google, build responsive combinations and visual assets around the same tested proposition, without assuming a social-feed edit will carry over unchanged.
The senior reviewer checks brand fit, policy risk, message clarity and whether the first frame makes sense without sound. A compliance check follows. Batch upload happens only after the score clears the shipping threshold.
The capacity maths
Take a planning example of 12 concepts per week, a 6% winner rate and a 14-day effective creative life. Two weeks of output gives 24 concepts. At a 6% hit rate, that produces 1.44 expected winners during the cycle.
The useful number is live inventory. If the account needs four active concepts per ad set and runs three material audience or placement groups, it needs 12 live assets before rotation. The 12 weekly concepts replenish that pool, while the 14-day life tells the team when fatigue monitoring must become aggressive.
That isn’t a promise of four winners. It is a capacity model. If the account has more spend, more placements or faster fatigue, increase supply before blaming the algorithm.
Our creative fatigue production maths explains how to connect output, lifespan and media demand without confusing asset count with testing quality.
A one-day turnaround only works when the queue is pre-built, the rubric is agreed and nobody waits three days for feedback on a five-word hook.
Scoring Creative Before You Spend a Dime
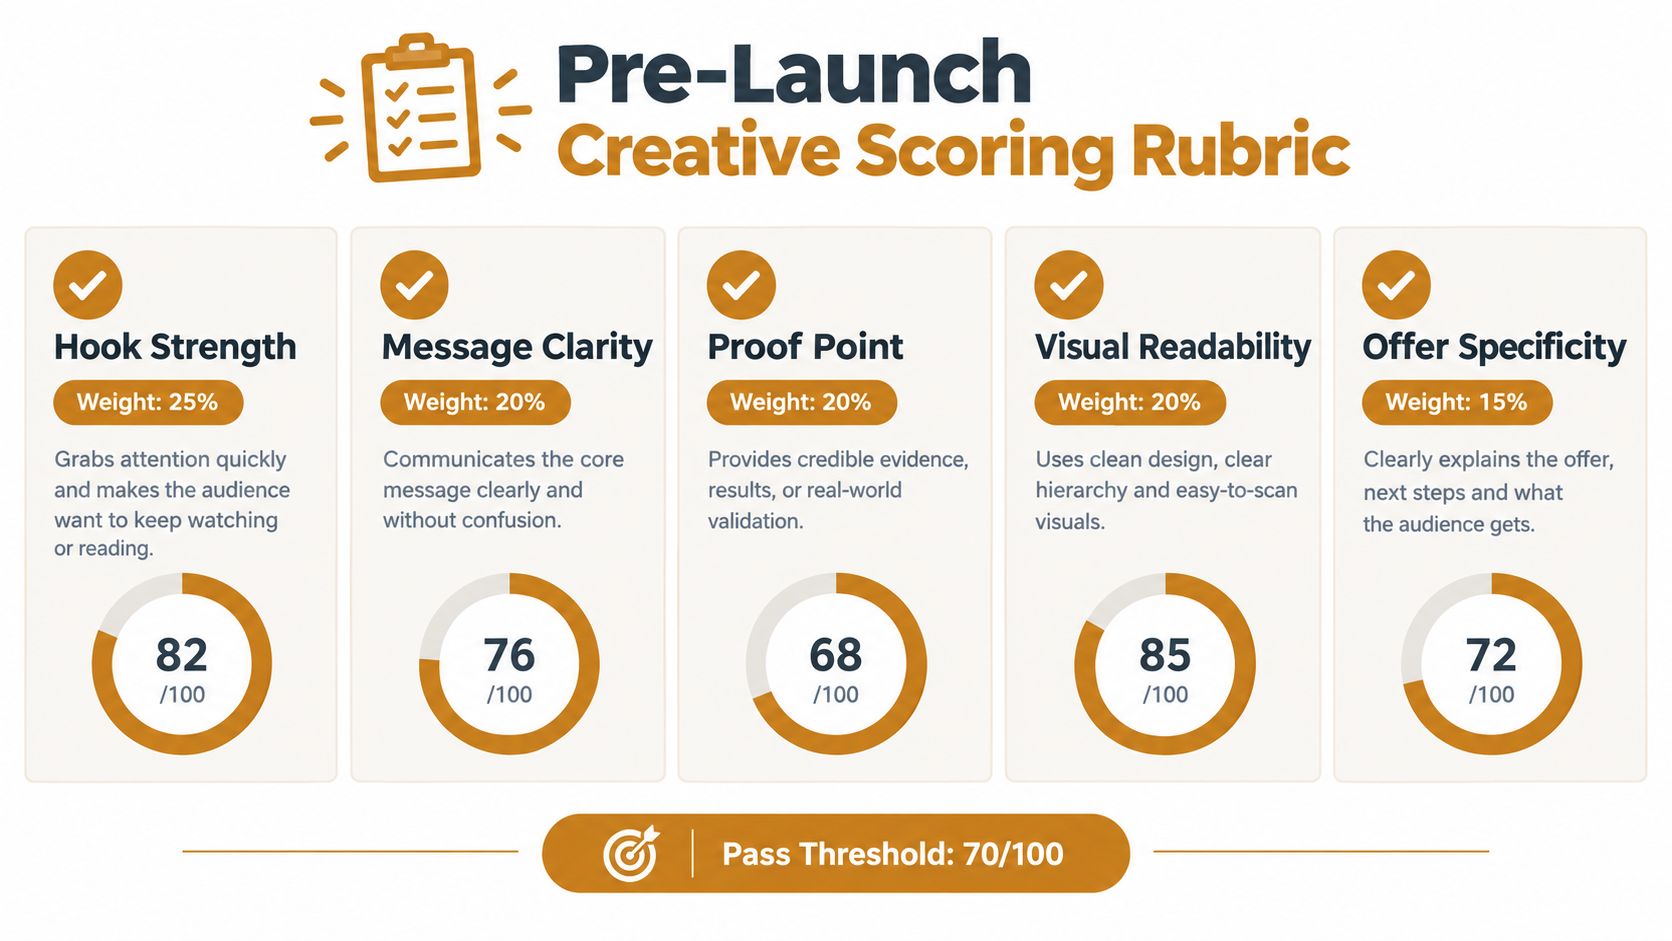
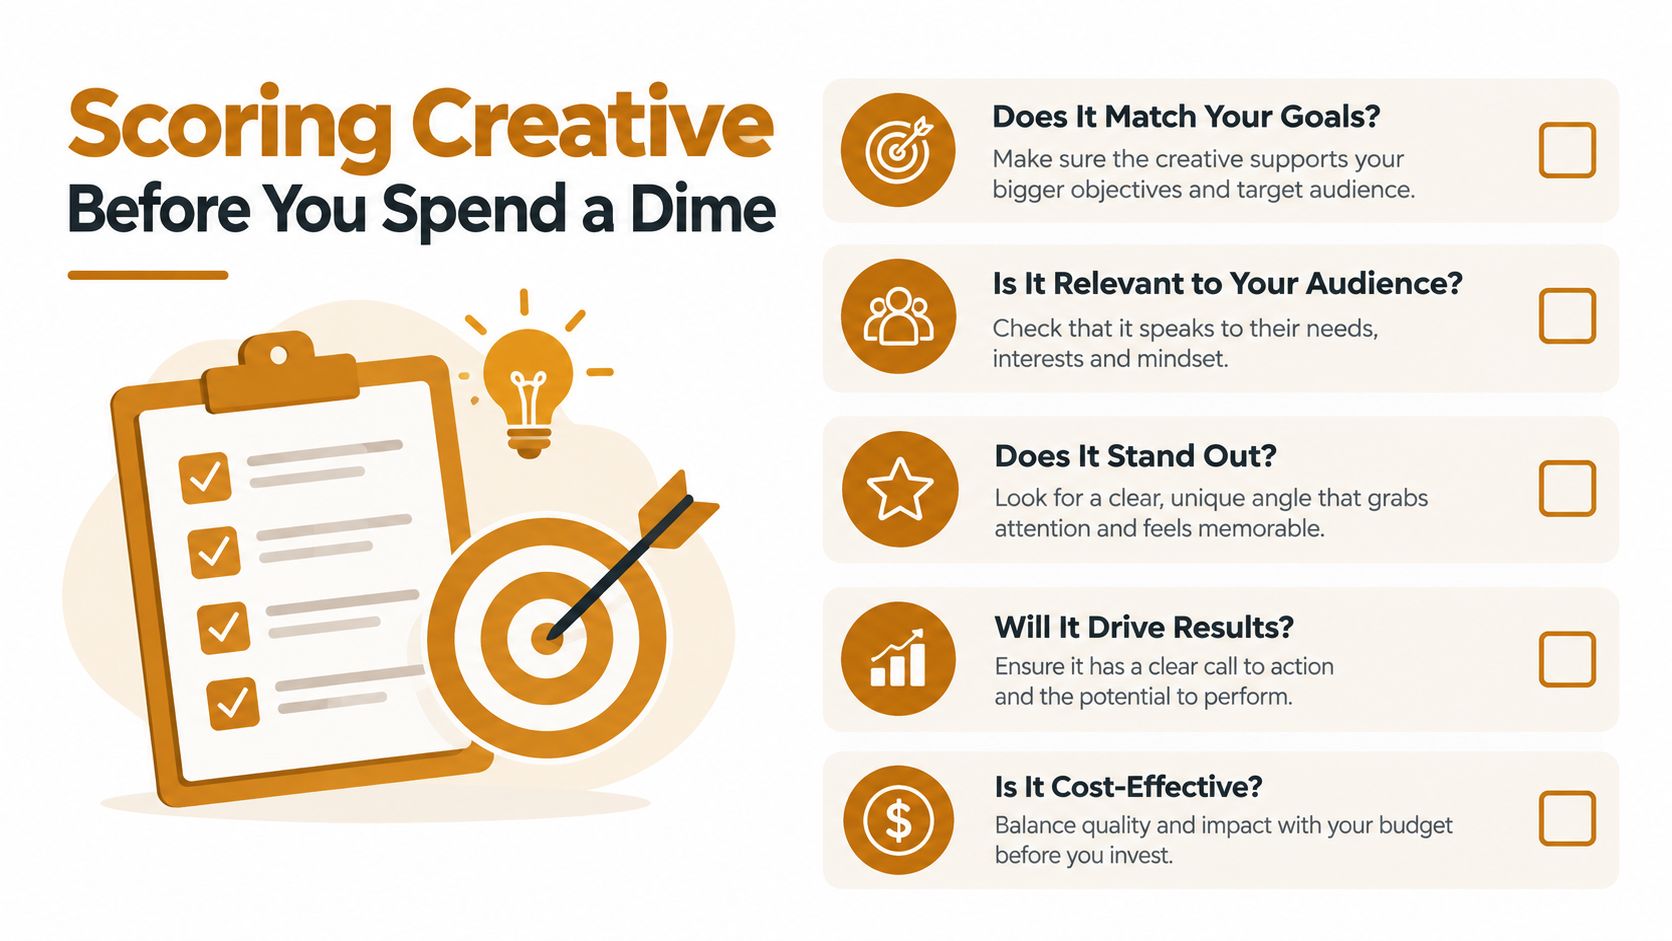
Pre-launch scoring should reject weak concepts before they consume production time or test budget. Use a weighted score out of 100, then set a hard pass threshold instead of relying on whoever speaks most confidently in the review.
The rubric below favours the elements that determine whether an ad earns attention and communicates value.
The five-part score
- Hook strength, 25 points: Does the opening create a specific reason to keep watching or reading?
- Message clarity, 20 points: Can a cold prospect identify the product, audience and outcome immediately?
- Proof point, 20 points: Does the concept contain evidence, demonstration, mechanism or a credible reason to believe?
- Visual readability, 20 points: Does the asset work on a small screen, in a fast feed and without audio?
- Offer specificity, 15 points: Is the action and commercial value clear, rather than hidden behind vague brand language?
Score each category from zero to its maximum, then add the results. A concept scoring 70/100 or more ships. A score from 55 to 69 enters iteration, but only with a named fix. Anything below 55 is killed unless the underlying customer insight is strong enough to justify a new treatment.
A brief with 22 hook points, 16 clarity points, 14 proof points, 13 readability points and 12 offer points totals 77/100, so it ships. A concept with strong visuals but no proof may look expensive and still deserve a lower score. Production polish can’t repair a missing reason to believe.
Why the filter matters
A 2026 report found that roughly half of all ads were switched off before reaching 28 days of spend. The reported ad retirement pattern makes pre-launch filtering valuable, but don’t confuse a low score with a guaranteed loser. The rubric protects capacity. It doesn’t replace live testing.
Creative quality has also been linked to material sales impact. A Meta-hosted summary of CreativeX and Kantar research reported 1.2 to 2.7 times higher long-term sales and 1.2 to 7.4 times higher short-term sales when creative best practices were followed. The Meta summary supports investing in the message before investing in the impression.
Score existing ads against the same framework during a free ad account audit. The point isn’t to admire the archive. It’s to find which missing criteria explain why the current pool is expensive to maintain.
Designing a Clean Test on Meta and Google
Creative volume only creates learning when the test isolates a decision. Change one meaningful variable and keep the rest stable. If the hook, audience, offer and bid strategy change together, the result is a story, not evidence.
Build one test cell around a single variable:
- Hook: pain-led versus outcome-led.
- Visual style: demonstration versus creator-led explanation.
- Offer: core product versus bundle.
- CTA: shop now versus compare options.
- Format: static versus vertical video.
Hold the audience, placements, conversion event, landing page, budget logic and bid strategy constant for the test period. On Google, isolate the asset or message inside a stable campaign structure. Do not change the landing page halfway through, then credit the thumbnail for the result.
The spend threshold
Use 50 conversion events as the minimum decision threshold before declaring a winner. The creative testing guidance supports reaching that event volume before making the call. If the campaign cannot reach 50 events within 14 days at your CPA, record the result as directional and extend the test.
Use a second maturity check at roughly $1,000 of clean ad-set spend, based on a 2026 report on Partnership Ads. The report on spend maturity before creative decisions warns that eventual winners can look weak early.
The maths is straightforward. If a clean ad set spends $1,000 over 14 days:
$1,000 ÷ 14 = $71.43 per day.
Fewer than 50 conversion events after that period does not justify certainty. Check tracking, record the result, and extend the test if the economics allow it.
Call a winner only when it beats the control on the agreed primary KPI without damaging the account-level metric that matters, such as CAC, CPA or MER. A higher click-through rate paired with fewer qualified leads is not a win. It is an attractive distraction.
A Meta account audit can identify contaminated tests, unstable conversion signals and budget changes that weaken attribution. Use those findings to clean the next weekly test cell before producing another batch.
Formats, Placements and Where 2026 Spend Is Moving
Creative volume only works when distribution keeps pace. A strong concept can still fail if its format, placement or account identity does not fit the environment. Treat distribution as part of production, not a media decision made after the assets are finished.
Ship a deliberate weekly mix of static assets, short-form vertical video, UGC, unboxing and offer-first banners. Give each concept a clear job, then adapt proven ideas for suitable placements. Do not fill the account with near-duplicates just to hit an asset count.
Format choices with a commercial job
Static assets support fast message tests and clear product proof. Vertical video earns its place when the product needs demonstration, movement or a human explanation. UGC helps when trust and lived experience matter more than polish.
Unboxing and offer-first banners deserve their own test cells rather than blanket adoption. A 2026 benchmark reported a 9.8% hit rate for unboxing and 8.6% for offer-first banner concepts. The creative benchmark source indicates that concept choice can influence the chance of finding a winner before media optimisation begins.
Partnership Ads are a distribution choice, not just another creative format. A 2026 report based on $130 million in spend across 65,000 ads reported 19% higher CTR, 10% higher conversion rates and 5% lower CPA than identical creative run from a brand account. The Partnership Ads report suggests that identity and delivery context can change performance even when the asset remains the same.
| Format or lever | Hit rate or lift | Source year |
|---|---|---|
| Unboxing concept | 9.8% hit rate | 2026 |
| Offer-first banner | 8.6% hit rate | 2026 |
| Partnership Ads CTR | 19% higher | 2026 |
| Partnership Ads conversion rate | 10% higher | 2026 |
| Partnership Ads CPA | 5% lower | 2026 |
Why more isn’t always better
An analysis of more than 1.1 million creative variations found that diverse creative across formats and message types delivered up to 32% improvement in CPA and 9% more incremental reach. The reported Meta analysis supports a useful operating rule: volume creates value only when the variations represent different ideas.
Five headlines over the same visual are five files, not five useful concepts. They provide one creative signal with cosmetic changes.
Before approving a batch, ask whether each asset changes the audience insight, proof mechanism, format or offer. If it does not, keep the stronger original in rotation and redirect production capacity. Our 2026 AI ad creative perspective makes the same case for automation: use it to produce controlled variation, while keeping editorial judgement with the creative and media team.
KPIs, SLAs and the Hand-off That Stops the Whole Thing Breaking
A creatives ads programme is a production and test system that ships a fixed number of scored concepts every week and retires losers fast enough to keep replacement rate ahead of fatigue.
Govern it with a short KPI list: hook rate, hold rate, thumb-stop ratio, CPA, MER and creative-driven share of incremental sales. Use one primary KPI per test, then monitor commercial guardrails so cheap clicks don’t disguise poor acquisition.
Ownership must be visible
The founder or CMO sets the commercial constraint. The media buyer writes the data-backed brief. The strategist scores the concept. The producer builds the asset. The compliance owner checks claims. The media buyer uploads, monitors and pauses. A senior operator reviews winners weekly, while the finance owner checks whether the result survives in MER.
Set a one-day creative turnaround, a two-hour response target, a weekly winner review and a monthly retirement audit. These are operating standards, not performance guarantees.
Read how to choose a paid social agency through that lens. Ask who owns each hand-off, what gets shipped weekly and what happens to weak ads.
The practical rule is simple. Tomorrow morning, count your active concepts, score the next batch and set a replacement target before changing targeting. Use the creative testing playbook to turn that target into a repeatable weekly cadence.
[[C11-OPTIN]]
Quick answers
How many new creatives should a scaled account ship weekly?
Start with 12 concepts per week for a scaled account, then adjust to spend, placement breadth and fatigue. The 2026 benchmark recorded 12 to 19+ weekly creatives in the top spend tier.
What percentage of ads become winners?
The 2026 benchmark reported that 5% to 8% of ads became winners across the analysed Meta dataset. Treat that as a planning reality, not a guaranteed account result.
What score should a concept need before production?
Use 70/100 as the shipping threshold. Send 55 to 69 back for a named revision and kill anything below 55 unless the customer insight deserves a completely different treatment.
How many variables should one test change?
Change one variable per test cell. That can be the hook, visual style, offer, CTA or format. Keep audience, placements, budget logic and conversion event stable.
When should a creative become a winner?
Wait until the test reaches 50 conversion events where possible, or roughly $1,000 in clean ad-set spend as a secondary maturity threshold. Check the primary KPI and the account-level economics before promotion.
Is more creative always better?
No. More volume beats intuition only when the concepts are genuinely different and distribution is controlled. Meta’s analysis found diverse creative delivered up to 32% better CPA and 9% more incremental reach, which makes variation more valuable than duplication.
Crank11 builds scored Meta and Google creative batches, runs the testing workflow and connects production decisions to paid-media economics. Visit Crank 11 to see how senior operators can turn weekly creative output into a governed acquisition system.