
Paid social agency is a third-party team that plans, buys, scores and retires paid social advertising on Meta, TikTok, LinkedIn and similar platforms. In 2025, social ad spend is forecast to hit $286.2 billion, up 12.3% year on year, and it’s projected to pass $300 billion in 2026, so the question is whether the agency can keep creative ahead of fatigue, not whether it can press buttons. WARC forecast coverage
Most agency pages still sell media buying. That framing is stale. At scale, the channel is not the problem. The creative engine is.
Paid Social Agency 2026: Creative Beats Buying
A paid social agency is a production and decision system that turns brief, creative, media, tracking and learning into spend decisions. The lazy version of the job is “manage ads”. The core version is to decide which concepts live, which get killed, and which deserve more budget before the account burns them out.
What a Paid Social Agency Actually Does in 2026
The job has turned into a four-part line, not a single desk. Brief intake, creative production, media activation and post-buy learning are separate functions, and the best operators treat them that way. Most buyer-facing pages blur those together because “we manage your ads” sounds tidy. It isn’t tidy at all.
The actual monthly output should be concrete. You want creative iterations, audience hypotheses, spend pacing, attribution logic and a documented retire-or-scale call on every ad. If the agency cannot show you those decisions, it’s mostly selling motion, not performance. That’s why a serious audit of the account matters before you let anyone call the shots, and why we point founders to a proper ad account audit checklist before they sign anything.
Who Owns What
- Creative team writes the hooks, edits the assets and ships the next round.
- Media buyer controls pacing, exclusions and budget allocation.
- Tracking owner checks pixel health, CAPI consistency and event quality.
- Analyst or strategist turns the mess into a decision the founder can act on.
Practical rule: if one person claims to own all four, you’re probably getting a generalist with a nice pitch deck and no throughput.
The label paid social agency hides this split. In 2026, the unit of work is no longer campaign setup. It’s the refresh cycle, and that cycle is measured in days, not quarters.
The Four Service Pillars and Which One Moves ROAS Most
Creative moves the most ROAS, by a wide margin. Buying matters, but it’s not where the large swings come from once spend is meaningful. If your senior person spends all day on bid tweaks, the account is probably under-managed where it counts.
Here’s the right way to think about the four pillars on a $35,000 per month DTC account running Meta and TikTok. Buying, creative, tracking and reporting all matter, but they do not move performance equally. The better the account matures, the more the lift comes from what is shown to people, not from tiny auction adjustments.
| Service pillar | Approx. share of ROAS movement | Primary deliverable |
|---|---|---|
| Buying | 10 to 15 percent | Bid strategy, exclusions, budget pacing |
| Creative | 50 to 60 percent | Concept volume, format mix, refresh cadence |
| Tracking | 15 to 20 percent | Pixel hygiene, CAPI accuracy, event quality |
| Reporting | 5 to 10 percent | Decision-ready readout, next actions |
That table is the point. A buyer who hires for “media management” first is usually overpaying for the least productive layer of the stack. The agency should earn its keep by producing more usable ads, not by talking longest in the weekly call.
The $35,000 month example
If the brand spends $35,000 a month, the agency’s weekly job is not fiddling with audience buckets all morning. It’s generating enough new creative angles to keep fresh inventory in market while bad ads are retired fast. If the account’s readout is pretty but the creative queue is thin, the agency is protecting its own comfort, not your margin.
Simple test: ask which part of the account would break first if creative production stopped for 30 days. If the answer is “nothing much”, the agency hasn’t told the truth.
That’s why evaluation should weight creative output and creative strategy before media tactics. Buying is table stakes. The work lives or dies on what gets made.
[[C11-OPTIN]]
The creative throughput checklist turns the next section into something you can use. It shows whether the shop can ship, or just talk.
Why Creative Throughput Now Beats Media Buying
Creative throughput beats media buying because the platforms already handle most of the auction legwork. The agency value has shifted from “who can tweak bids best” to “who can keep fresh assets coming before the machine exhausts the winners”.
The fatigue problem is the whole game now. Independent coverage notes that automation concentrates spend on the best-performing ads faster, which burns winners out sooner, and broader industry commentary says paid social is hitting saturation, ad fatigue, rising CPMs and privacy drag. The operational answer is blunt, keep producing, scoring and retiring creative faster than the decay sets in. See our notes on why ads fatigue if you want the unsentimental version.
The half-life problem
A saturated prospecting audience can turn a good ad stale fast. If you’re only shipping a couple of new concepts a month, you’re not running a creative system. You’re feeding an exhausted one.
That is why throughput wins. The best paid social agency is not the one with the fanciest media dashboard. It’s the one with a machine for turning concepts into assets, then killing the weak ones without sentimentality.
What to watch for
- Freshness over polish: a decent new angle beats a tired masterpiece.
- Retire fast: if an ad is flat, stop pretending it will come back.
- Score weekly: creative needs a verdict, not a shrine.
- Make volume normal: if shipping feels exceptional, the process is too slow.
The platforms have become very good at spending money. They are still bad at inventing the next winning ad.
That’s the part most agency guides skip. Buying is increasingly a commodity layer. The binding constraint is creative supply, and that’s why we at Crank11 treat production speed as a core operating metric, not a nice-to-have.
How Paid Social Agencies Price the Work
Pricing shows who carries the creative risk. That matters more than the sticker price, because a cheap structure can hide the wrong incentive.
Three models dominate. Percentage-of-spend usually runs at 10 to 20 percent, flat retainers often sit between $4,000 and $15,000 a month, and hybrid retainers with fixed creative production are common in scaling accounts. Independent guidance also points to agency minimums in the low-thousands each month.
Here’s the maths on a $50,000 monthly spend. At 12 to 20 percent, the agency revenue is $6,000 to $10,000 before any separate production charge. If the deal is a flat $8,000 retainer, creative may be billed separately, which means the agency can collect the fee without being forced to ship enough new assets. Hybrid models split the pain more cleanly, because the production line is priced openly instead of buried inside management hours.
| Model | Agency revenue | Creative production cost | Who carries creative throughput risk |
|---|---|---|---|
| Percentage of spend | $6,000 to $10,000 | Usually separate or implicit | Mostly the client |
| Flat retainer | About $8,000 | Often separate | Mostly the client |
| Hybrid retainer plus production | About $5,000 retainer plus around $6,000 production | Explicit and scoped | Shared, but clearer |
The hybrid is usually the least dishonest structure for bigger accounts. It forces the agency to answer for how many assets get made, not just how much time gets burned in Slack. If your brand is already spending heavily, the question is not what costs less. It is who is on the hook when creative dries up.
For a pricing lens that cuts through the sales fluff, compare every proposal against our agency pricing breakdown. Same spend. Different incentives. Very different outcomes.
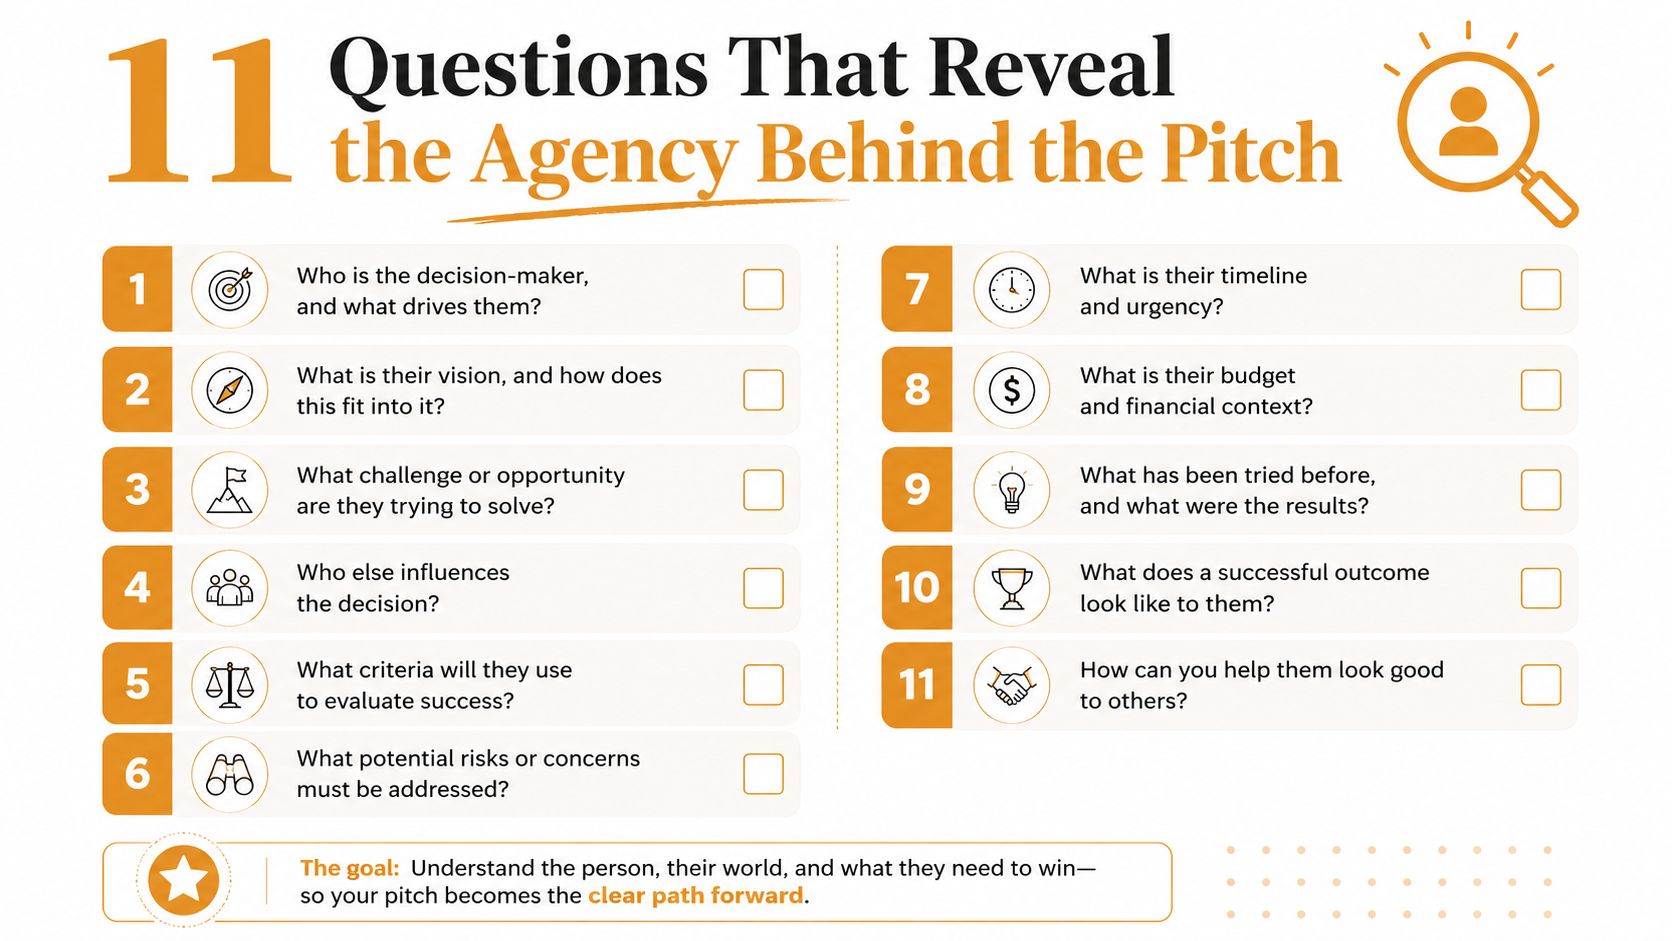
Eleven Questions That Reveal the Agency Behind the Pitch
The right questions expose operating reality. The wrong ones invite theatre. If you skip the first three below, you’re basically buying a story about competence.
Start with creative volume
- How many net-new ads did you ship last month? Bad answer, “we tested several concepts”. You want shipped assets, not ideas.
- What percentage were retired within 14 days? Bad answer, “we don’t track that”. Then you don’t know what died.
- Who made them? Bad answer, “the team”. Translation, nobody is accountable.
Then test operational discipline
- How often do you refresh prospecting creative? Bad answer, “as needed”. That means never on purpose.
- What changes do you make before touching budgets? Bad answer, “we optimise continuously”. That’s consultant fog.
- What does a bad ad look like in your system? Bad answer, “we review performance weekly”. Too late.
Then probe tracking and reporting
- What breaks first when attribution gets messy? Bad answer, “our dashboard still shows the trend”. So what.
- What do you want the founder to do after the report? Bad answer, “review results”. Empty.
- How do you separate signal from platform noise? Bad answer, “we use our proprietary dashboard”. Usually just a wrapper.
- Which events do you trust least? Bad answer, “the funnel is healthy”. That’s not an answer.
- What happens if creative dries up for two weeks? Bad answer, “we’d adapt”. Adapt to what, exactly.
Use this rule: if the pitch is heavy on capability and light on shipment history, you’re being sold labour hours dressed up as strategy.
The questions matter because most vendors can talk. Far fewer can show a clean creative ledger. For a sharper version of this review process, use the account analysis note before you take the first call seriously.
What a Serious Testing Programme Requires
Serious testing needs traffic. Without it, “testing” is just guessing with nicer slides. A real CRO test depends on baseline conversion rate, minimum detectable effect, statistical power, confidence level, test direction, and the number of variants, with 95 percent confidence and 80 percent power commonly used as the default bar. Keep the Sample size calculator guidance handy.
Small tests mislead. A 2 percent baseline moving to 2.5 percent can require roughly 24,000 to 26,000 visitors per variant to clear that bar, so polished opinions do not count for much. If the account cannot feed the test, the test is theatre.
What that means in practice
A brand doing $50,000 a month at a 2 percent site-wide conversion rate generates about 1,000 conversions a month. That pace means one rigorous test can consume a large share of traffic time, and multi-cell setups stretch the runway even more. The maths is not glamorous, but it keeps the account honest.
If an agency promises weekly multivariate wins on a modest account, ask how much traffic each variant actually sees. Silence is your answer.
For a harder look at test design and account discipline, keep the lab playbook close. Serious agencies work with constraints. Amateur ones pretend the sample size problem does not exist.
Senior Operators, Junior Staff, or an AI-Assisted Engine
The operating model matters as much as the service list. A polished pitch can hide a shop that changes hands every quarter.
Here’s the straight comparison.
| Buyer criterion | Senior-only model | Junior-heavy model | AI-assisted engine | Winner |
|---|---|---|---|---|
| Creative throughput | Strong, but limited by human time | Weak, often slow | Strong | AI-assisted engine |
| Response time | Fast | Inconsistent | Fast | AI-assisted engine |
| Cost efficiency | Expensive | Cheap on paper | Usually better balanced | AI-assisted engine |
| Account retention | Strong | Fragile | Moderate to strong | Senior-only model |
| Testing depth | Sharp judgement, fewer bets | Shallow | High volume, disciplined | AI-assisted engine |
The senior-only model suits accounts where judgement is priceless and volume is manageable. The junior-heavy model is the classic scaling trap, because the slide deck looks big while the actual operator keeps rotating out. The AI-assisted engine wins where output volume and speed matter, which is why our 2026 creative engine notes matter more than the old agency org chart.
Match the model to the spend
If you’re at the lower end of serious spend, a senior-only structure can be the cleanest fit. Once creative volume rises, the AI-assisted model makes more sense because it can produce more variants without turning the account into a staffing experiment.
Hard truth: the wrong model is usually chosen to make the agency look premium, not to make the account perform.
Crank11 sits on the senior side of that split for strategy and sign-off, then uses an AI-assisted production engine to keep the output moving. That mix is boring in the right way. It ships.
[[C11-OPTIN]]
The next morning’s job is simple, and the majority won’t do it. Pull the last 90 days of ad-level creative exports and count distinct assets. If the number is below 20, you’ve got a creative throughput problem, no matter who owns the account.
Quick answers
What does a paid social agency do? It plans, buys, tests, and retires ads across paid social channels, then feeds those results into the next round of creative and spend decisions.
How much do agencies usually charge? Pricing usually lands in a percentage-of-spend model or a monthly retainer. The right model is the one that makes creative throughput visible and keeps responsibility clear.
What’s the biggest red flag? An agency that talks about media buying but cannot show creative refresh speed, asset volume, or fast retire decisions.
Is testing always useful? No. Without enough traffic, testing turns into noise. Small accounts hit the wall fast, as noted earlier.
What should I ask first? Ask how many net-new ads they shipped last month, then ask how many they killed quickly. That tells you whether they run a creative system.
Tomorrow morning, count your last 90 days of creative, then ask the current or prospective agency to show the refresh rate and retire decisions behind those assets. If you want the operating playbook behind that standard, start with Crank 11.