
A widely cited 2026 Google Ads ROAS benchmark is 3.52x overall, with 5.17x for Search and 0.12x for Display. That split matters more than the headline average, because campaign type, attribution and margin can turn the same reported ROAS into either a profitable acquisition engine or a very expensive vanity metric.
The popular advice is to pick a benchmark and push bids until you reach it. We disagree. ROAS is a diagnostic signal, not a universal target, and the useful number is the one rebuilt from your economics.
What the Google Ads ROAS benchmark actually is in 2026
ROAS is attributed revenue divided by advertising spend. A reported 4.0x means the platform assigned £4 in revenue to every £1 spent. It does not mean the business made £3 in profit.
The widely cited 2026 benchmark reports a 3.52x median across Google Ads campaign types, with Search at 5.17x and Display at 0.12x, alongside Meta Ads at 2.21x and Microsoft Ads at 3.18x in the same dataset, according to Focus Digital’s 2026 Google Ads ROAS benchmark.
Those figures are directional, not targets. Search captures existing demand, while Display creates or interrupts demand. Attribution windows can also move reported revenue between campaigns, so a benchmark is mechanically shaped by campaign type, measurement settings and the value assigned to later purchases.
The benchmark is a starting point
A 4:1 return can still lose money at a 25% gross margin. The £4 of attributed revenue produces £1 of gross profit, which is then consumed by £1 of advertising spend before fulfilment, payment fees, refunds, staff or creative production.
- Revenue: £4 from each £1 of ad spend.
- Gross profit at 25% margin: £1.
- Ad spend: £1.
- Result before other operating costs: £0.
Customer lifetime value changes the calculation. If the first purchase is deliberately low-margin but customers reorder, a lower first-order ROAS may be acceptable. If repeat purchasing is rare, the same number is a warning.
| Campaign type | Median ROAS | Sample size | Confidence |
|---|---|---|---|
| All Google Ads campaigns | 3.52x | Not disclosed in the cited summary | Directional |
| Search | 5.17x | Not disclosed in the cited summary | Directional |
| Display | 0.12x | Not disclosed in the cited summary | Directional |
The industry dataset cited by SuperScale’s 2026 industry benchmark analysis reports a 3.31x median across 28 industries. A separate dataset covering more than 18,000 brands recorded Google Ads ROAS at 3.31x, down from 3.68x in 2024, a 10.03% year-over-year decline.
The useful question is not “How do we hit 3.52x?” It is “What return does this campaign need after margin, attribution and customer value?” That answer sets the bid maths.
Google Ads ROAS by industry and vertical
Industry economics matter more than a blanket platform average. Categories with repeat purchases, healthy contribution margins and short consideration periods can support different targets from low-margin products or lead-generation businesses where revenue arrives later.
A cited 2025 dataset reports Google Ads ROAS of 2.12x in Health & Wellness, 4.30x in Travel Accessories & Luggage and 3.98x in Apparel & Accessories, based on SuperScale’s breakdown of ROAS by industry. Use those figures as context, not operating instructions. They can flag an account that sits materially outside its category, but they cannot set its profitable bid target.
Treat vertical data as a sanity check
Industry averages hide the economics that determine whether a campaign is viable. A premium product and a commodity product may share a category while carrying different margins, return rates, conversion rates and repeat-purchase behaviour.
Triple Whale’s 2026 benchmark summary reports ROAS declines across 13 of 14 industries in 2025. Its named movements include Travel Accessories and Luggage falling 21.10% to 4.30x, Health and Wellness falling 15.64% to 2.12x, and Consumer Electronics falling 11.45% to 3.02x, as detailed in Triple Whale’s Google Ads benchmarks.
| Industry or vertical | Reported benchmark | Direction |
|---|---|---|
| Health & Wellness | 2.12x | Declining |
| Consumer Electronics | 3.02x | Declining |
| Apparel & Accessories | 3.98x | Category-specific |
| Travel Accessories & Luggage | 4.30x | Declining |
“The account is below industry average” is not a diagnosis. It only justifies investigation. Check query quality, feed structure, offer strength, margin, landing-page conversion and measurement before changing bids.
For ecommerce, Benchmarketing’s 2026 ecommerce benchmark data places Google Ads at about 3.1x median ROAS, around 5.2x for top-quartile accounts, with another large-account dataset reporting a blended ecommerce average of 4.2x. That spread matters. Account quality, product mix and conversion tracking all change what the platform can attribute.
Use the benchmark to segment performance by product, campaign and customer type. Your real target still comes from margin, attribution and customer value, not a number pasted into a bid strategy.
How campaign type changes the ROAS benchmark
Search, Shopping, Performance Max and Display should never share one performance expectation. Search usually benefits from explicit commercial intent, while broader inventory can collect credit from users who were already close to converting.
The available benchmark data conflicts on the precise ordering of Search and Shopping. One dataset reports Shopping at 5.1x versus Search at 3.4x, while another reports Search at 5.17x and Shopping at 2.88x, as documented in Webtonic’s ecommerce Google Ads statistics. That disagreement isn’t an inconvenience to hide. It shows how account mix and attribution can invert the headline.
Read placement before changing bids
Search can produce strong efficiency on bottom-funnel terms because the query itself carries intent. Shopping depends heavily on the feed, product price, availability and query matching. Performance Max blends inventory, so its reported return can include demand that branded Search would otherwise capture.
Display sits at the weak end of the cited Google Ads benchmark, at 0.12x median ROAS in the broad 2026 dataset. That doesn’t make Display useless. It does make a direct-response ROAS comparison with Search intellectually lazy.
| Campaign type | Cited benchmark | Dominant environment | Intent profile |
|---|---|---|---|
| Search | 5.17x median | Search results | Explicit |
| Shopping | 5.1x or 2.88x, depending on dataset | Product results | Product-led |
| Performance Max | No single verified figure in the supplied data | Mixed inventory | Blended |
| Display | 0.12x median | Display placements | Interruptive |
Our position is simple: stop benchmarking Performance Max against branded Search. Audit placement, brand overlap, new-customer contribution and query quality first.
If you’re evaluating outside support, the paid social agency selection guide is useful for the same reason. The operating model matters more than a polished benchmark slide.
Why the same ROAS can mean very different things
Two accounts reporting 4.0x can have materially different commercial outcomes. Start with the arithmetic, not the dashboard colour.
Account A reports £40,000 revenue on £10,000 spend using a 7-day click window. Account B reports the same £40,000 on £10,000, but uses a 30-day engagement window. The ratios are identical, yet Account B has a much larger opportunity to capture delayed or assisted conversions that Account A excludes.
That does not prove Account B is overstating performance by a fixed amount. It proves the figures aren’t comparable without matching the window and model.
The distortion matrix
Branded and non-branded traffic create another trap. A campaign can report excellent ROAS by harvesting existing demand, while generic acquisition deteriorates underneath. View-through conversions, cross-device journeys, offline imports and platform-assigned assisted credit add more variation.
| Variable | Account A reading | Account B reading | What changes |
|---|---|---|---|
| Attribution window | 7-day click | 30-day engagement | Delayed credit differs |
| Brand mix | Brand-heavy | Generic-heavy | Incrementality differs |
| Revenue timing | Online purchase | Offline close | Platform visibility differs |
| Customer value | First order | Repeat or subscription value | Economic return differs |
A subscription customer’s first order might be £40, while the business’s 12-month value is higher. If the platform reports 3.1x on the first order and the measured 12-month value produces 9.2x, the campaign should not be killed because the short-window view looks ordinary. Those figures are from the supplied scenario, not a universal benchmark.
Data-driven attribution can also reallocate credit between campaigns. Performance Max may receive part of a conversion path that previously appeared under Search, changing reported campaign ROAS without changing the customer’s journey.
Practical rule: ROAS is comparable only inside one account, one conversion window and one attribution model.
We use the ratio of ROAS to conversion-window length as a rough diagnostic signal, not a profitability metric. A 4.0x result over 7 days and a 4.0x result over 30 days need separate investigation.
The cost of operating a channel also belongs in the decision. The agency versus in-house cost maths helps expose why platform ROAS and real acquisition economics are different ledgers.
Lead gen ROAS targets when revenue is delayed
Lead-generation accounts should optimise to qualified pipeline value, not pretend every click has immediate revenue. Pure ROAS is dangerous for businesses where sales close weeks or months after the initial enquiry.
A practical replacement is qualified lead cost against expected value. Model lead value from close rate multiplied by deal size, then include the percentage of leads that become sales-qualified opportunities.
A worked lead-gen example
Suppose a SaaS account pays £80 per MQL, converts 12% of MQLs to SQLs, closes 22% of SQLs, and has £14,000 ACV. The short-window dashboard may show a reported 2.1x ROAS, while a 36-month LTV view in the supplied scenario produces 8.4x.
The point isn’t to worship the larger number. It’s to make the revenue path visible. If the sales team closes offline, import qualified stages and closed revenue back into the advertising account, then judge campaigns against pipeline and payback.
| Lead-gen context | Reported view | Better operating metric |
|---|---|---|
| Immediate ecommerce-style conversion | 2.1x scenario | Revenue ROAS |
| Delayed SaaS sales | 8.4x LTV scenario | Qualified pipeline and LTV |
| Offline service close | Not directly visible | Qualified lead cost |
| Long sales cycle | Short-window ROAS | Payback and pipeline ROAS |
A campaign can look weak on a 30-day view while producing profitable customers at day 180. Killing it early confuses reporting delay with commercial failure.
For an account health review, the account audit findings checklist is a useful prompt for checking tracking, funnel stages and signal quality before touching spend.
How to diagnose and lift ROAS in a high-spend account
The biggest ROAS gains usually come from search-term pruning and correct margin-based targets, not another round of bid-strategy tinkering. We start by cleaning the measurement and traffic before asking the algorithm to make a better decision.
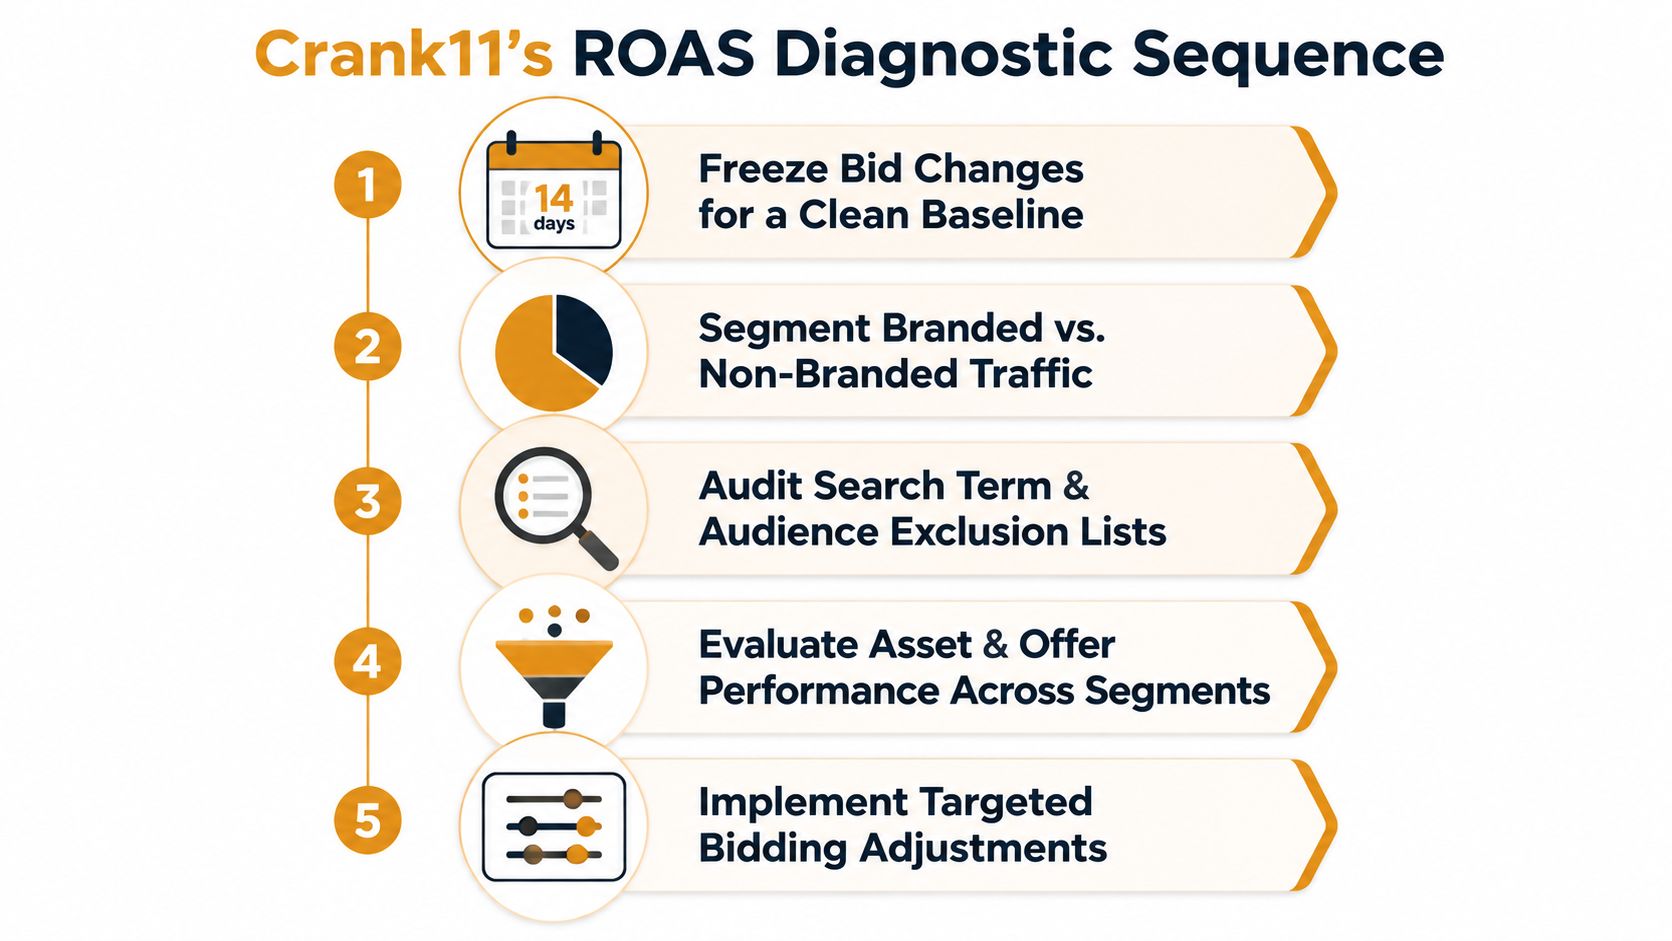
The operating sequence
-
Freeze bid changes for 14 days. Establish a clean baseline. Constant edits make it impossible to distinguish a real account problem from self-inflicted volatility.
-
Split brand from non-brand. Calculate each separately. Blended ROAS often conceals weak generic acquisition behind cheap branded demand.
-
Audit search terms and exclusions. Find queries converting below economic break-even, then negate them, restructure them or move them into a capped-bid campaign. Do not judge a query only by its platform conversion label.
-
Rebuild the target from margin. Start with gross margin, then subtract handling and fulfilment costs. A target based on revenue margin alone is a phantom target.
-
Fix conversion signals. Move to a data-driven attribution model where the data supports it, import offline conversions, and ensure the value passed to the platform reflects actual commercial value.
-
Tighten Performance Max. Use audience signals as directional inputs, apply campaign-level exclusions where available, and separate brand, generic and competitor intent rather than accepting one blended pool.
-
Move budget deliberately. Shift 10% to 20% into higher-intent exact and phrase-match Search where auction pressure and query quality justify it.
The sequence is deliberately boring. Boring works.
The self-audit guide for paid ad accounts can help structure the first pass, particularly where teams have inherited years of edits and unclear conversion actions.
Where Crank11 fits
Crank11 works with senior operators on Google Ads management, creative production, funnel builds and conversion-rate optimisation. The practical distinction is connected accountability. If the landing page, tracking and ad account each belong to different vendors, ROAS diagnosis becomes a blame exchange.
The single rule to set your real ROAS target
Set target ROAS from contribution margin and measurable customer value, not from a benchmark report. The operating formula is:
Target ROAS = Gross Margin ÷ (Attribution Capture Rate × LTV Adjustment)
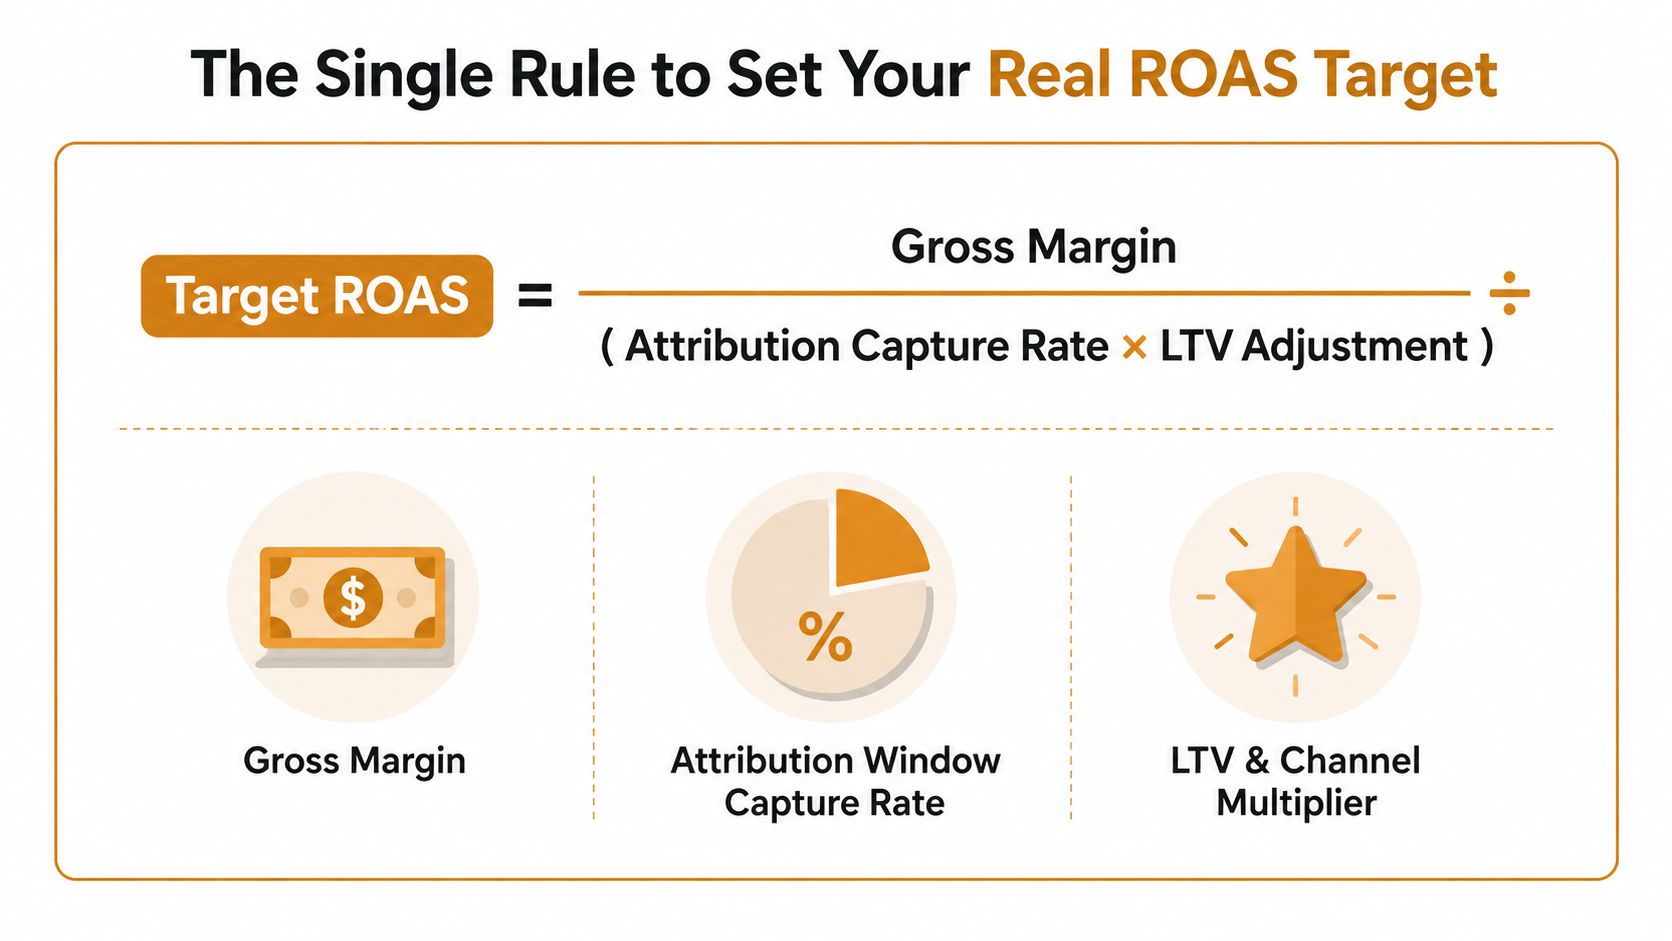
For a simple ecommerce account with 60% gross margin, a short attribution window that captures only part of realised demand means the platform target must be interpreted alongside blended revenue. For a lead-gen account with 25% margin economics and a 90-day LTV, first-order ROAS is a poor stopping rule because the commercial value arrives after the click.
The formula isn’t a licence to inflate LTV assumptions. Use realised cohorts, agreed revenue stages and a conservative attribution capture rate. If finance can’t trace the value, don’t feed the platform an optimistic number.
Benchmark chasing is one of the quietest ways high-spend accounts leak margin.
Spend one hour rebuilding the target from margin, fulfilment cost, LTV and incrementality before changing bids. Then review fortnightly against actual blended ROAS, not platform-reported ROAS.
The same discipline applies to creative. The creative production maths helps connect asset volume, fatigue and conversion performance without treating every dip as a bidding problem.
[[C11-OPTIN]]
Use the ROAS target worksheet to translate margin, attribution and LTV into a bid target your finance team can defend.
Quick answers
Why does ROAS look different in Google Ads and GA4?
Each system applies its own attribution settings, conversion definitions, lookback windows and data availability. Before comparing them, match the conversion event, date range, attribution model and revenue source. Two figures can both be internally consistent while still disagreeing.
Is a 2x ROAS acceptable in 2026?
There is no universal pass mark. Contribution margin, fulfilment costs, new-customer mix and future customer value decide whether 2x works. The cited 2026 benchmark range runs from 2.12x in Health & Wellness to 4.30x in Travel Accessories & Luggage. That context is useful, but it cannot replace account-level economics. A high-margin or high-LTV model may tolerate 2x. A low-margin retailer may lose money at the same figure.
How should lead-gen accounts set a ROAS proxy?
Use qualified lead cost, pipeline value and payback rather than an early revenue event. Estimate expected value from the qualified-stage rate, close rate and deal value, then import offline outcomes into bidding. If sales has not qualified the lead, the recorded conversion says little about commercial value.
What happens when attribution changes to data-driven?
Credit can shift between campaigns and channels. Search may receive fewer assigned conversions while Performance Max receives more, or the reverse. Treat the change as a measurement break, annotate the date and rebuild the baseline. Do not interpret the first movement as an immediate performance collapse.
When is sub-1x ROAS acceptable?
It can make sense for new-customer acquisition when repeat value is strong and cash flow covers the payback period. Growth alone is not proof. Test realised cohorts, retain a separate first-order contribution view and set a clear point at which delayed value must show up.
How often should the benchmark be reviewed?
Review account economics fortnightly and benchmark context quarterly. Industry and campaign mix change the reported result, so an annual target becomes stale quickly. Recheck the target after changes to attribution, conversion definitions, product mix, margin or LTV.
[[C11-OPTIN]]
If attribution errors are large enough to affect budget decisions, use the ROAS audit to separate tracking noise from genuine margin leakage.
Tomorrow morning, split branded from non-branded ROAS, freeze unnecessary bid edits and rebuild the target from contribution margin before changing spend. Crank11 can turn that diagnostic into a practical Google Ads, funnel and CRO playbook. Visit Crank 11 to see how we operate.