
The median Facebook ROAS benchmark for DTC ecommerce is 1.86x across a panel of roughly 35,000 brands, not the 3x or 4x figure most guides repeat. A 2x return can be normal, while a 3x return can still lose money if your contribution margin is thin.
The universal target is wrong because ROAS measures attributed revenue against ad spend, not profit. We set targets from margin, funnel stage and attribution quality, then use market benchmarks as context rather than permission to scale.
Why the 3x Facebook ROAS Benchmark Is Wrong
Facebook ROAS is a ratio that divides platform-attributed revenue by ad spend to measure efficiency. It doesn’t tell you whether the order produced profit after product cost, fulfilment, returns, payment fees or discounts.
The strongest available DTC reference point is a 1.86x median Meta ROAS in 2026, drawn from a panel of roughly 35,000 brands. The same source places ecommerce conversion rate around 1.53% to 1.60%, which matters because the return reflects ordinary conversion conditions, not an imaginary account where every click becomes a sale. See the 2026 Meta Ads benchmark data for ecommerce.
A separate industry benchmark using Varos data reports a 2.19x median across 28 industries. Those figures sit well below the old 4:1 rule and below the 3x target agencies routinely paste into a slide deck. They don’t prove that 1.86x is good for your business. They prove that performance is distributed around category economics rather than a universal score. The broader benchmark discussion is available in Meta advertising benchmark context.
The target has to come from contribution
Suppose your gross margin is 30%. A 3x ROAS leaves one third of revenue for every other cost before profit. A brand with a 55% gross margin has a completely different tolerance. The same platform number can be healthy in one account and destructive in another.
That’s why we disagree with the usual advice. Don’t set a target because a benchmark looks impressive. Set it because the target clears your break-even and leaves room for operating costs.
Practical rule: A benchmark tells you what other accounts report. Your contribution margin tells you what you can afford.
Operators spending $30,000 or more per month need a stricter standard. At that level, a blended ROAS can hide prospecting waste behind a small retargeting pool, while an attribution window can make weak incrementality look productive. If you’re choosing outside help, the paid social agency evaluation guide should start with measurement ownership, margin logic and creative output, not a promised multiplier.
Facebook ROAS Benchmarks by Industry and Percentile
Industry benchmarks are useful only after you separate category, percentile and campaign intent. Published 2026 reference points range from 1.8x to 10.0x or more, depending on product economics and funnel stage, so the phrase “good Facebook ROAS” is incomplete without those qualifiers. The industry benchmark breakdown shows why.
A planning table that doesn’t flatter the account
One ecommerce benchmark reports a 1.86x median, a 2.87x average and about 5.2x for top-quartile accounts. The average sits higher because a smaller group of strong accounts pulls it upwards. For forecasting, median is the safer starting point.
| Category or account band | 25th percentile | Median | 75th percentile |
|---|---|---|---|
| Ecommerce, technical benchmark | 1.5x | 1.86x | 4.5x |
| Ecommerce, top-account reference | Not reported | 2.87x average | 5.2x top quartile |
| Apparel and beauty | Not reported | 3.0x+ reference | Not reported |
| Furniture and electronics | Not reported | 1.8x to 2.5x reference | Not reported |
| Retargeting campaigns | Not reported | 5.0x to 10.0x+ reference | Not reported |
The first row uses the published percentile spread with the 1.86x median and the 4.5x 75th percentile reported by the benchmark source. The top-account reference comes from the separate ecommerce benchmark. The category and retargeting bands are published 2026 reference ranges, not guarantees. Read the full ecommerce ROAS benchmark comparison before applying any row to a budget plan.
Why category ranges can mislead
Apparel and beauty can report 3.0x or above in some benchmark sets, while higher-ticket furniture and electronics can sit around 1.8x to 2.5x. A larger order value doesn’t automatically produce a better return. Longer consideration, lower purchase frequency and higher fulfilment costs can pull the economics in the opposite direction.
Retargeting often shows 5.0x to 10.0x or more, but that number isn’t a prospecting benchmark. The audience already contains people who clicked, visited or engaged. If prospecting stops feeding that pool, the retargeting result eventually loses its source.
Use the median for planning, the percentile spread for diagnosis and your contribution margin for decisions. Our self-audit process for Meta ad accounts checks whether the reported number comes from genuine improvement or merely a warmer audience mix.
A benchmark is a reference point, not a target.
How to Calculate Your Own ROAS Target from Margin
Your break-even ROAS is 1 divided by contribution margin. That formula is more useful than any Facebook ROAS benchmark because it connects the acquisition decision to what each sale can carry.
The worked calculation
Use these named inputs:
- Gross margin: 55%
- Monthly ad spend: $30,000
- Break-even formula: 1 ÷ 0.55
- Operating buffer: 30% to 50% above break-even
The calculation is:
1 ÷ 0.55 = 1.818, which rounds to a 1.82x break-even ROAS.
At $30,000 of monthly spend, a 1.82x return produces:
$30,000 × 1.82 = $54,600 attributed revenue
That $54,600 covers the advertising relationship with a 55% margin. It doesn’t mean the business has solved profit, because salaries, fulfilment, refunds and overhead still sit outside this simplified calculation.
A 30% to 50% buffer above break-even gives a practical prospecting target of roughly 2.2x to 2.8x. At $30,000 spend, that represents $66,000 to $84,000 in attributed monthly revenue. Those figures are derived from the margin example and the published target guidance for a 55% margin, not from an industry average. The source sets out the margin-based ROAS target calculation.
Why the same ROAS changes meaning
If your margin is lower, break-even rises. If repeat purchases recover an initially weak first order, the allowable acquisition cost changes over the customer payback period. If reported revenue includes returning customers who would’ve purchased anyway, platform ROAS can overstate incremental performance.
Run the calculation twice. First, use the margin available on the initial order. Then use a separate acquisition view that includes only new-customer revenue. Don’t blend those numbers and call the result a target.
Margin beats averages. Every time.
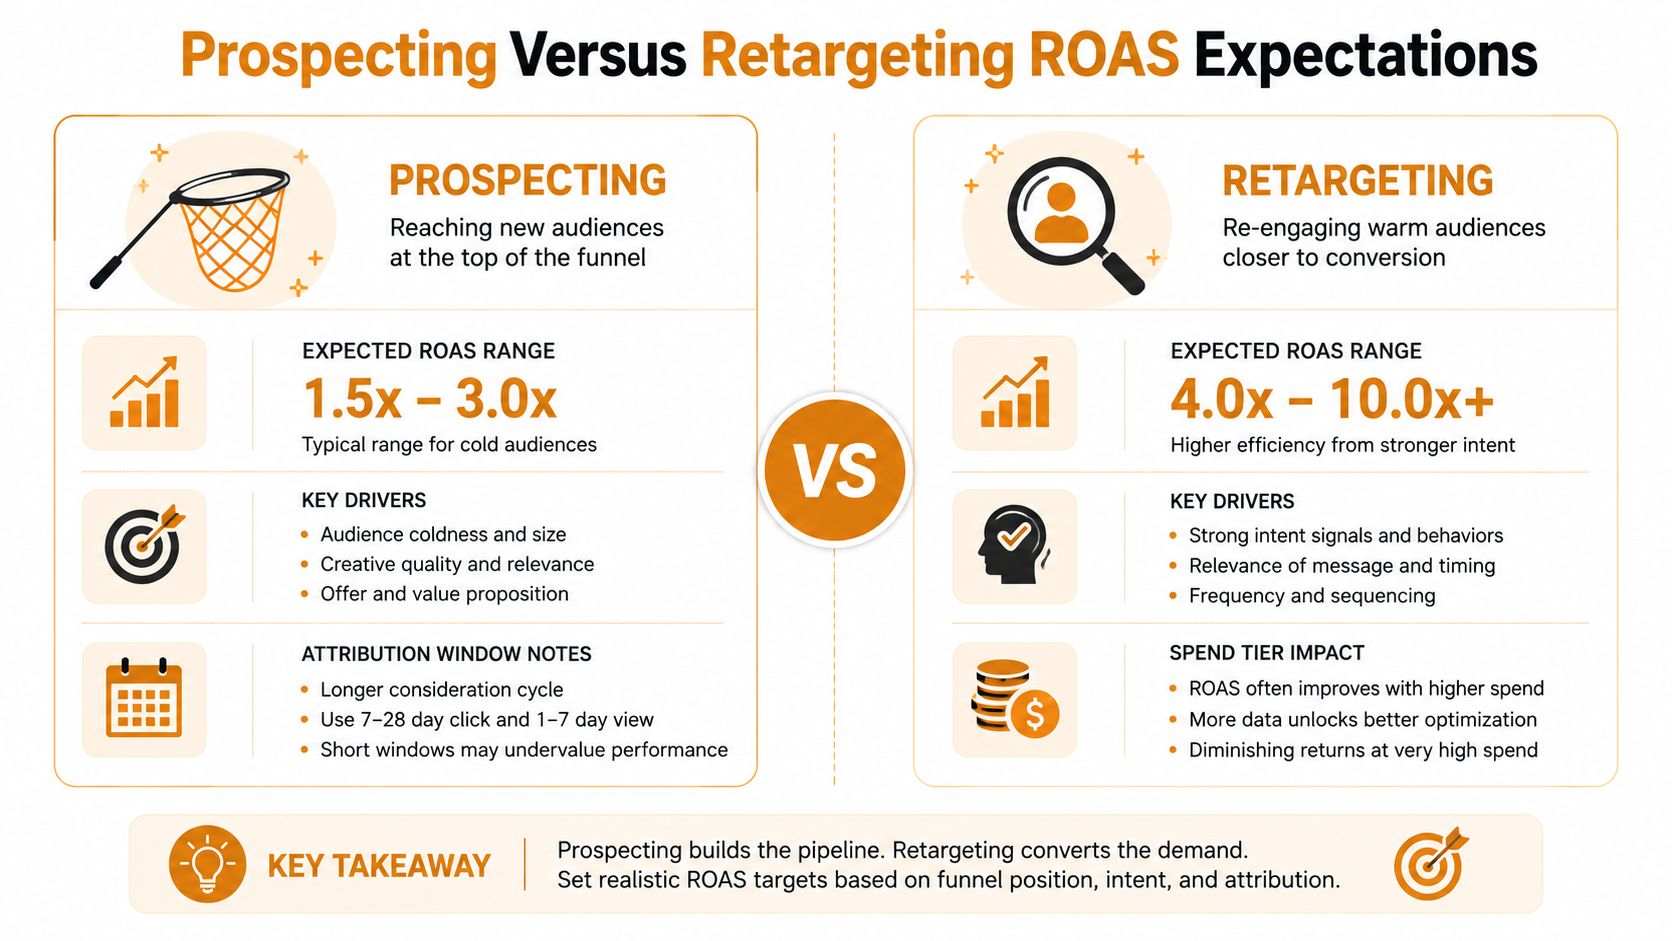
Prospecting Versus Retargeting ROAS Expectations
Prospecting and retargeting need separate targets because they perform different jobs. Prospecting creates new demand and builds the audience, while retargeting monetises existing intent, so a single account-level number hides the trade-off.
Retargeting reference ranges can reach 5.0x to 10.0x or more, while broader campaign references put prospecting closer to the lower end of market ranges. That doesn’t make retargeting the better place for every pound. A small warm audience can absorb only so much spend before frequency and incrementality deteriorate.
Attribution changes the reported answer
A 7-day click attribution window will generally report more attributed revenue than a 1-day view window, because it gives more interactions credit for a purchase. Compare like with like. Changing the window during a performance review can create a false improvement without changing sales.
Accounts spending above $100,000 per month can also show lower reported ROAS as audiences saturate and incremental returns decay. That’s a scaling constraint, not proof that the channel has stopped working. The relevant question is whether new-customer contribution remains acceptable as spend expands.
Run this decision checklist
- Scale prospecting when new-customer ROAS clears your personalised target across a consistent attribution window and backend revenue doesn’t contradict it.
- Hold spend when reported ROAS is near target but conversion volume, contribution or audience quality is unstable.
- Pull back prospecting when the result stays below break-even after creative and landing-page checks.
- Protect retargeting when it remains profitable, but don’t let it conceal weak new-customer acquisition.
- Rebuild measurement when platform revenue rises while tracked backend revenue stays flat.
We treat creative as the variable that lets prospecting improve without forcing the audience into a smaller, warmer pool. Our 2026 approach to AI-assisted ad creative covers the production side, but the rule is simple. Separate the funnel before judging the number.
Tactical Levers That Actually Move ROAS
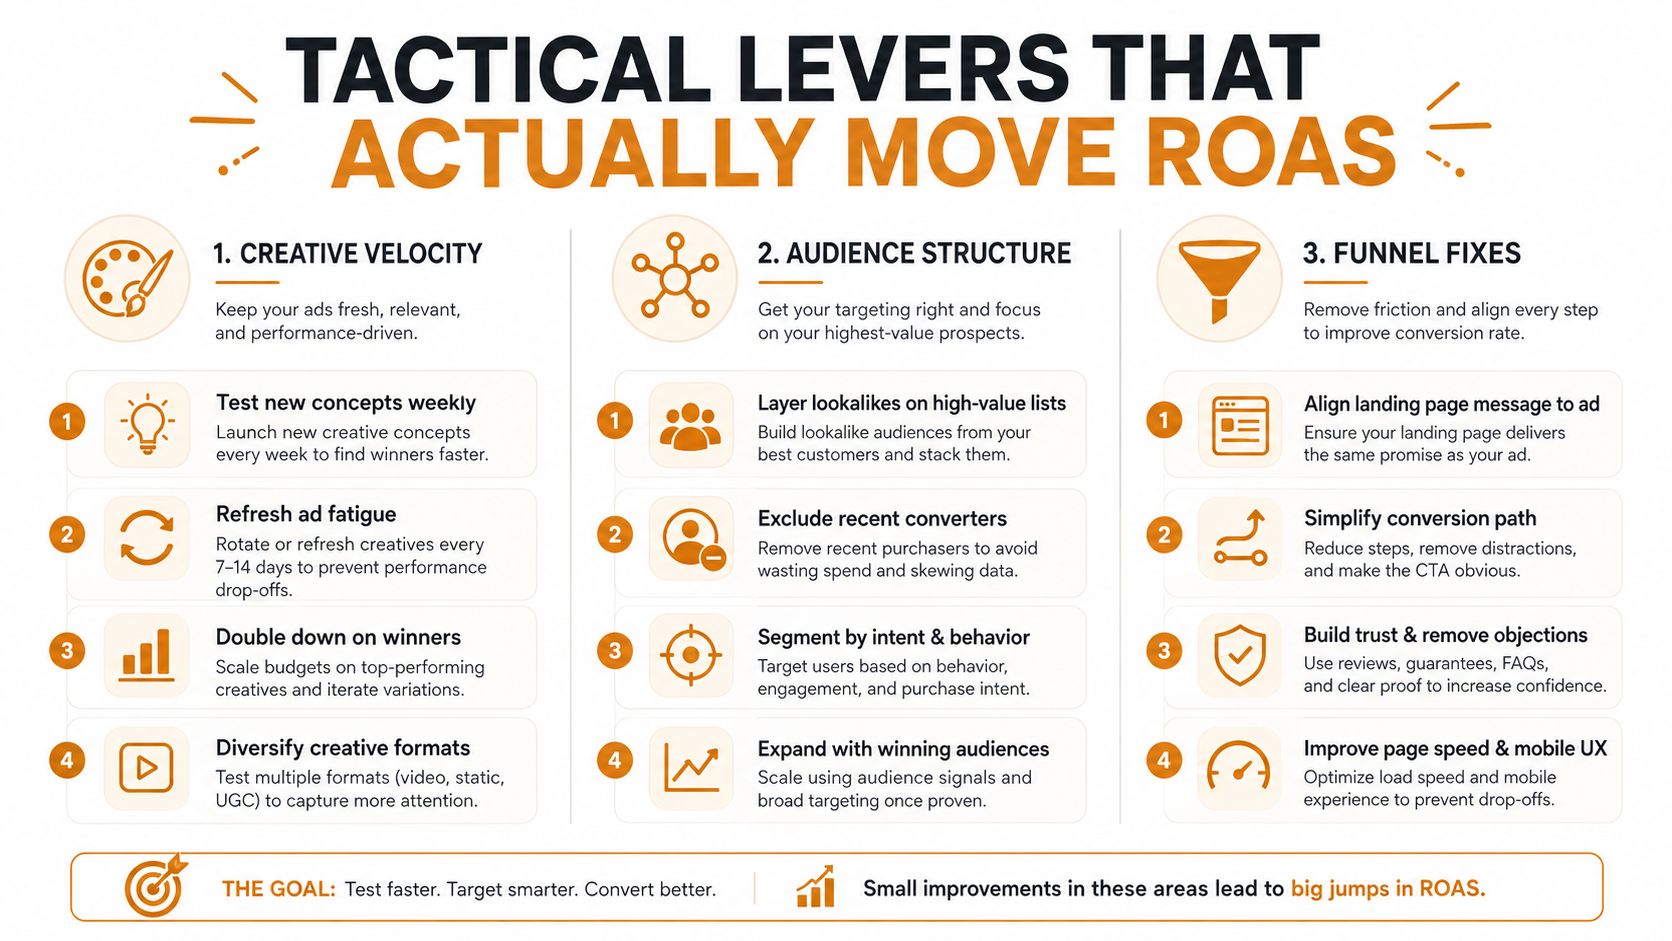
Creative, audience structure and the funnel move ROAS more reliably than bid tinkering. Crank11 has reported a +32% average ROAS improvement from its operating approach, but that figure isn’t a promise for another account. The useful lesson is where to look first, not what result to expect.
Diagnose the failure before changing settings
Creative fatigue usually appears as weaker engagement and rising acquisition cost while the offer and landing page remain unchanged. The fix is a new concept, not a minor colour edit. A fresh cut of the same exhausted idea is still exhausted.
Audience saturation appears when prospecting reaches the same people repeatedly and incremental conversion quality falls. Exclusions, broader audience structures and new creative angles can help, but don’t use targeting changes to rescue an offer nobody wants.
Funnel leakage appears when click quality looks acceptable but the product page or checkout fails to convert. Message mismatch, slow mobile experiences and unnecessary steps waste the demand your ads already created.
The fastest route to a higher ROAS is often removing a conversion failure after the click.
Use a three-column review:
- Creative velocity: Are new concepts entering the account frequently enough to replace fatigued winners?
- Audience structure: Are recent converters excluded where appropriate, and are prospecting and retargeting measured separately?
- Funnel fixes: Does the landing page repeat the ad promise and make the next action obvious?
The creative fatigue diagnosis guide is useful when performance decays after a period of stability. Don’t increase bids first. Identify which part of the conversion chain changed, then test one meaningful intervention at a time.
Reporting Template and Decision Checklist
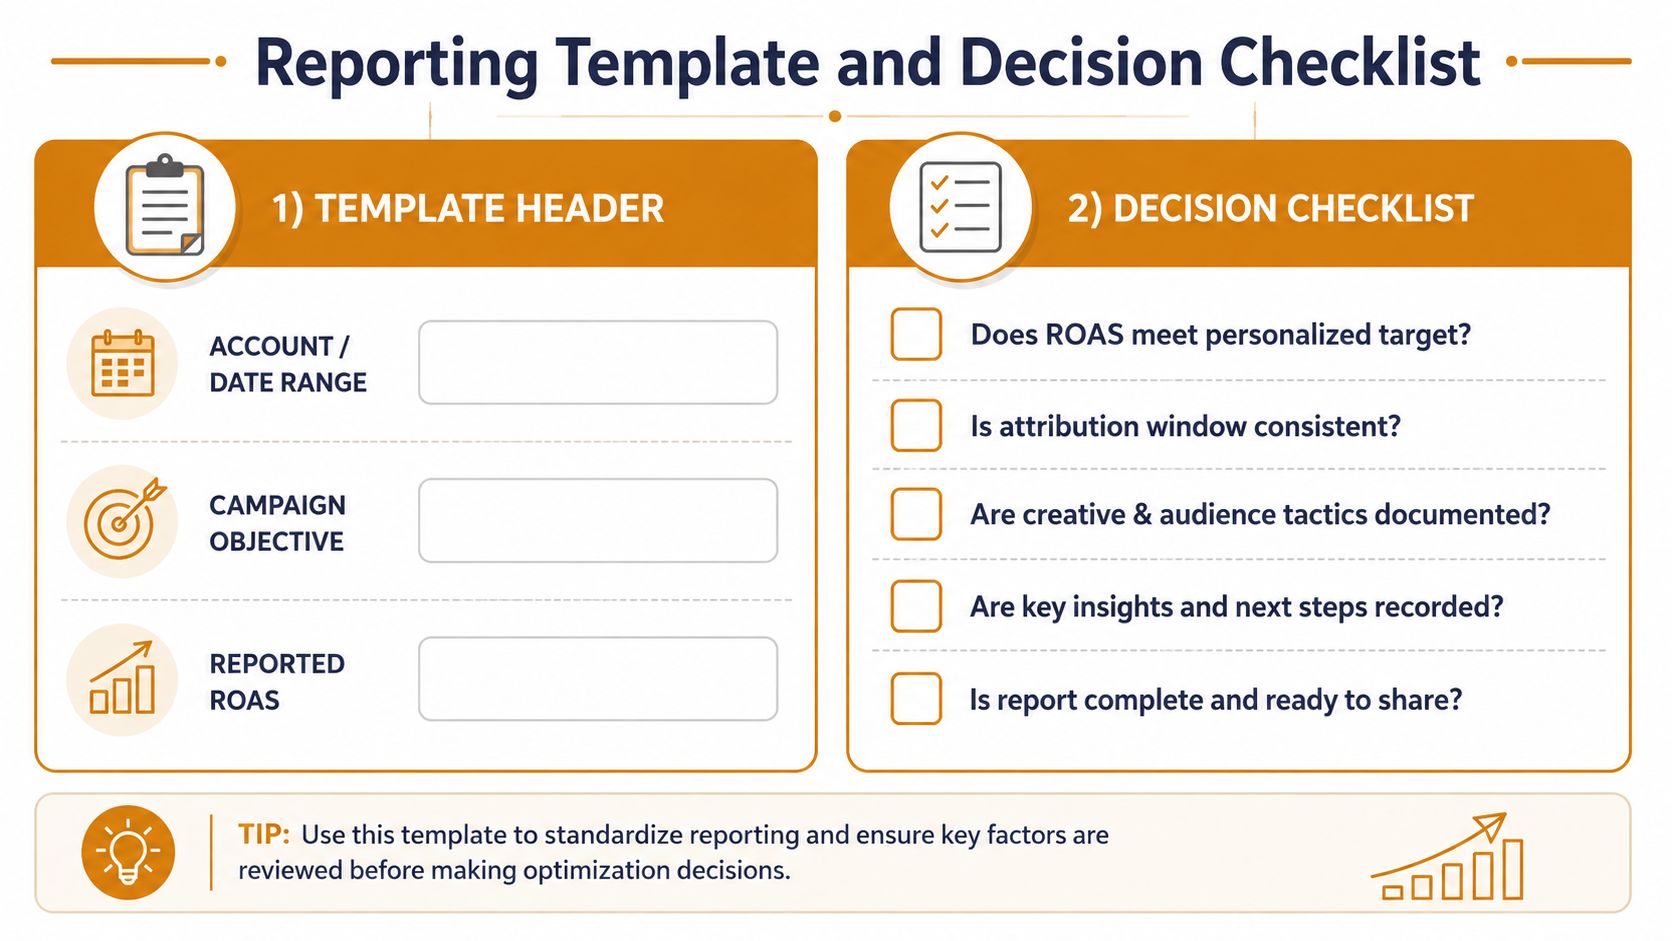
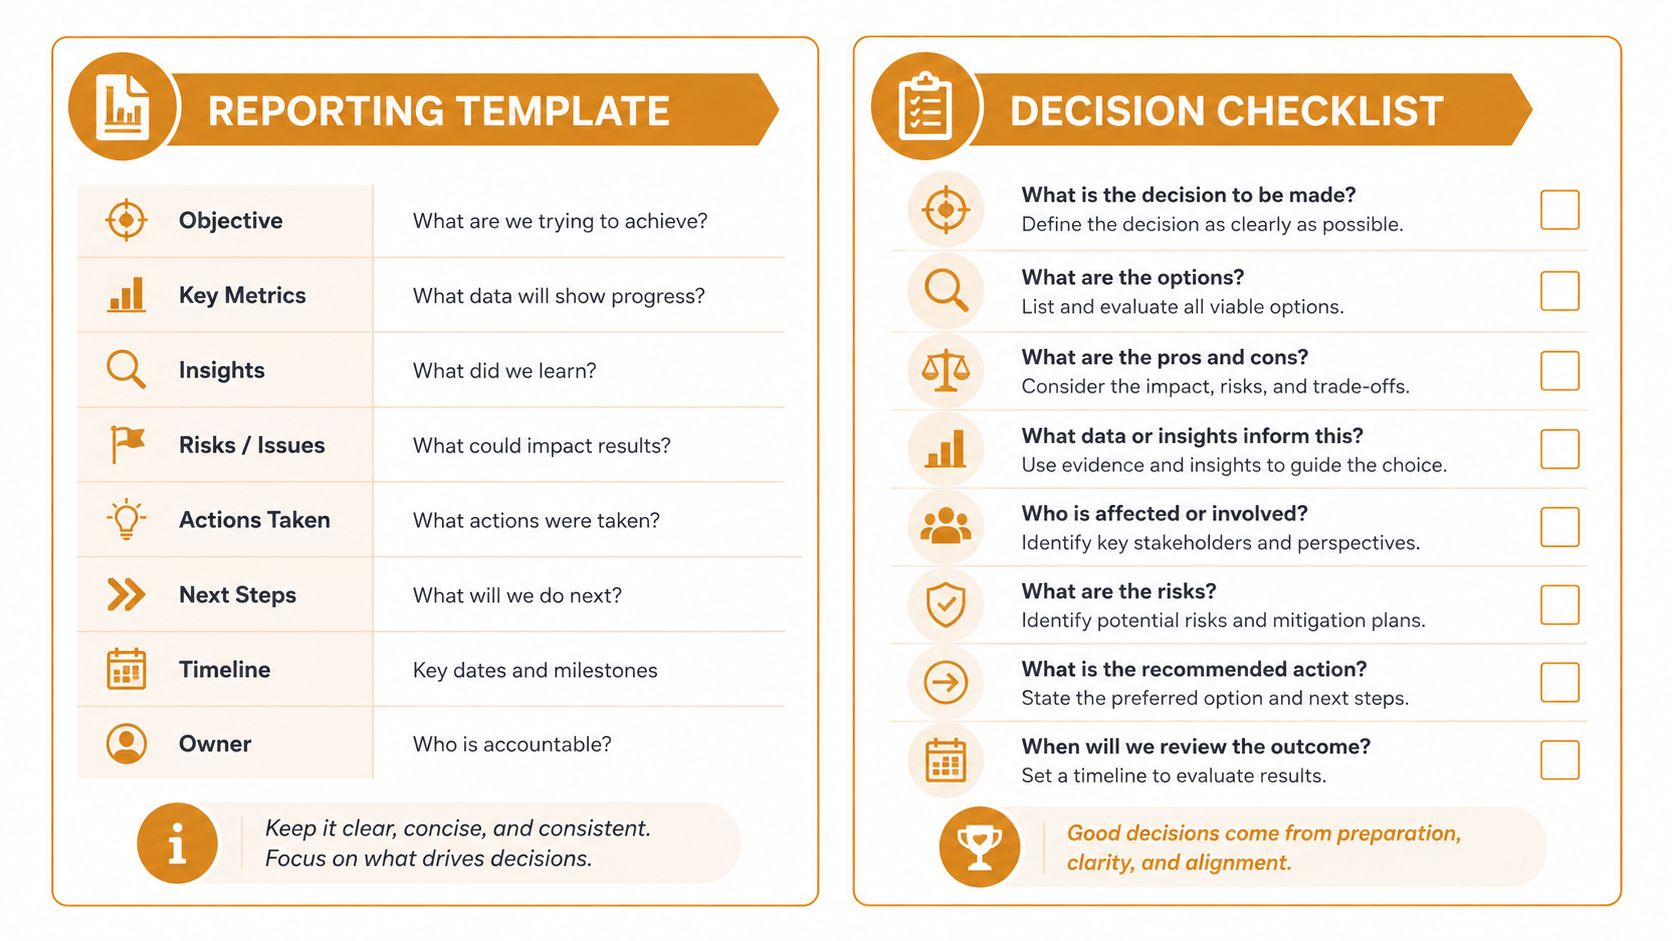
A useful report shows ROAS by funnel stage, attribution window, customer type and creative cohort. One blended account number belongs in the summary, not at the centre of the decision.
Start tomorrow with this header:
| Field | Record |
|---|---|
| Account and date range | Exact account name and reporting period |
| Campaign objective | Prospecting, retargeting or lead generation |
| Attribution window | Fixed window used for the comparison |
| Reported ROAS | Platform-attributed revenue divided by spend |
| Backend revenue | Revenue reconciled against order or CRM records |
| Personalised target | Margin-derived threshold |
| Decision | Scale, hold, cut or investigate |
The nine checks we run first
- Confirm spend dates. Don’t compare a partial period with a completed one.
- Lock the attribution window. A changed window invalidates a simple trend comparison.
- Separate new and returning customers. Acquisition efficiency is not retention efficiency.
- Check contribution margin. Revenue alone can’t approve budget.
- Reconcile platform revenue. Look for divergence from ecommerce or CRM records.
- Group creative by concept. Several edits of one idea aren’t several tests.
- Inspect audience temperature. Warm-pool growth can disguise prospecting weakness.
- Review landing-page conversion. A click doesn’t justify scaling if the page leaks demand.
- Record the decision rule. Write down why spend increased, held or fell.
Scale only when the personalised target is cleared and backend evidence is directionally consistent. Hold when the number is close but the signal is noisy. Cut when contribution stays below break-even after the obvious measurement and funnel faults are removed.
The Meta account audit findings guide shows the kind of evidence we expect before recommending a budget change. A report should explain what happened, why it happened and what action follows.
[[C11-OPTIN]]
Quick Answers on Facebook ROAS Benchmarks
Is 2x ROAS good for a 55% margin?
Yes, it clears the 1.82x break-even calculation for a 55% margin, but it leaves less room than a prospecting target with a 30% to 50% buffer. Check contribution after fulfilment and returns before scaling.
What Facebook ROAS benchmark should a DTC brand use?
Use the 1.86x median as a conservative market reference, then replace it with your margin-derived target. A market median isn’t a profitability threshold.
Should prospecting and retargeting share one target?
No. Retargeting references can reach 5.0x to 10.0x or more, while prospecting has colder traffic and different incremental value. Separate reporting prevents warm audiences from hiding acquisition waste.
Why can a 3x ROAS still lose money?
ROAS counts attributed revenue and ad spend. It excludes product cost, fulfilment, refunds and overhead, so a 3x return can remain unprofitable where contribution margin is too low.
When should a campaign stop scaling?
Stop increasing spend when the result remains below your personalised threshold after checking attribution, creative, audience structure and landing-page conversion. Don’t scale from a platform number that backend revenue doesn’t support.
[[C11-OPTIN]]
Tomorrow morning, calculate break-even ROAS from contribution margin and set separate prospecting and retargeting thresholds. Use the ROAS reporting playbook to put those checks into a repeatable operating rhythm.
Crank11 works with ecommerce and lead-generation operators spending $30,000 or more each month on paid traffic, covering creative, media buying, funnels and CRO with senior operator oversight. Visit Crank 11 to review the free ad account audit and see whether your reported ROAS matches the economics underneath it.