
Average landing page conversion rate is 6.6% median across all industries, based on 41,000 landing pages, 464 million visits, and 57 million conversions. Useful baseline. Bad target if you buy traffic at scale, because that median hides industry mix, device mix, and intent quality.
Most paid teams use the number wrongly. They treat 6.6% like a verdict on page quality, when it’s really a blended output of who clicked, what they expected, what device they used, and how much friction you put between click and action.
If you’re spending £30k+ a month on acquisition, that distinction matters. A page at 4.2% in one context might be fine. The same page at 4.2% in another could be setting fire to budget. At Crank11, we look at benchmarks as planning inputs, not goals. The job isn’t to “beat average”. The job is to know which average matters, what’s dragging it down, and what a one point lift does to CPA before you touch the page.
Introduction
The headline benchmark is clean enough. The strongest neutral baseline is Unbounce’s 2024 benchmark, which found a 6.6% median landing page conversion rate across all industries from 41,000 landing pages, 464 million visitors and 57 million conversions, published in Unbounce’s 2024 conversion benchmark coverage.
That’s the answer people want. It’s not the answer they need.
A dedicated landing page is a single-purpose page that turns paid or campaign traffic into one defined action. If you stop there, you’ll miss the part that affects budget allocation. A median of 6.6% tells you the middle page in a huge dataset. It doesn’t tell you whether your blend of paid social, paid search, retargeting, mobile traffic, cold audiences, long forms, weak proof, or messy tracking is what’s depressing your number.
Average landing page conversion rate is a planning benchmark, not a diagnosis.
The benchmark itself also changed the conversation. A summary of the same benchmark family notes that the old 2% to 5% rule of thumb has given way to dataset-backed medians, with 10%+ pages now treated as strong and top performers consistently clearing that line in benchmark roundups, as outlined in Involve Me’s 2026 benchmark summary.
For founders and media buyers, the useful question isn’t “what’s average”. It’s this. What mix of industry, traffic quality and device is sitting underneath your number, and how much does a lift from mediocre to competent change your paid maths this month.
What Average Landing Page Conversion Rate Actually Measures
It measures one thing. How many visitors complete the page’s primary action.
Average landing page conversion rate is a page-level performance metric that shows the share of visitors who take the intended action after arriving on a dedicated landing page.
That sounds obvious. It isn’t, because plenty of teams compare a dedicated page against a sitewide conversion rate, or they quote an average when the benchmark they’re using is a median.
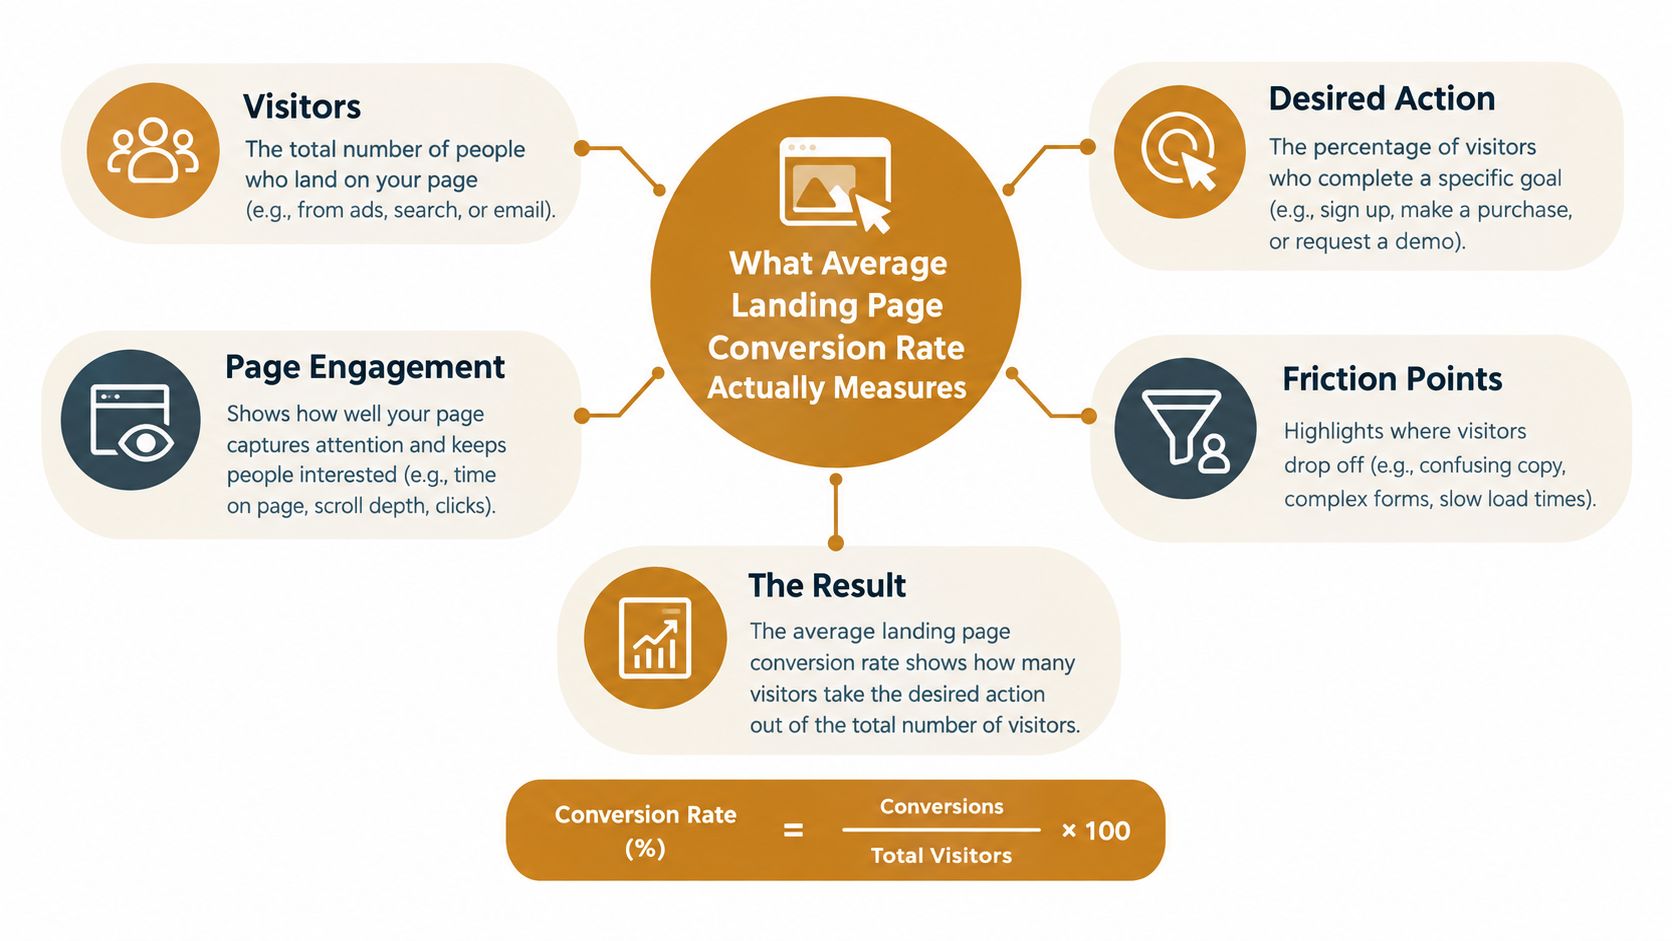
The metric is simple, the interpretation isn’t
The page calculation is basic maths.
- Visitors: the number of sessions or users landing on the page in a given period
- Conversions: the number of completed primary actions in that same period
- Rate: conversions divided by visitors
Worked example. If you spend £30,000 in one month, pay £2.50 per click, and drive 12,000 visits to one landing page, a 6.6% conversion rate produces 792 conversions. The maths is 12,000 × 0.066 = 792. Your cost per conversion is £30,000 ÷ 792 = £37.88.
That number means something operationally. It tells you how expensive your page friction is.
Why median matters more than mean
The strongest benchmark uses a median, not a mean. That matters because outlier pages can distort a mean and make normal planning useless. The benchmark most worth using for paid funnels is 6.6% median across all industries, built from 41,000 landing pages, 464 million visits, and 57 million conversions, which Unbounce details in its conversion benchmark report.
Median is better for budget planning because it reflects the middle performer, not the pages with freakishly warm traffic or bizarrely high intent. If your page sits below that, you’re not automatically in trouble. But if you’re buying qualified traffic and still trailing badly, you probably have either audience mismatch, offer mismatch, or a measurement problem.
Practical rule: compare dedicated pages to dedicated page benchmarks, not to sitewide CVR, blended funnel CVR, or checkout completion rates.
If your tracking doesn’t separate landing-page visitors from broader site traffic, fix that first. We’ve shown the exact failure points in this ad account audit walkthrough.
Average Landing Page Conversion Rate Benchmarks by Industry
There is no universal “good” number. There are only useful peer sets.
The same benchmark family that gives you the 6.6% all-industry median also shows a wide spread by industry. Unbounce’s medians range from 3.8% in SaaS to 12.3% in events and entertainment, with ecommerce at 4.2%, financial services at 8.3%, and professional services at 6.1%, as summarised in DesignRush’s benchmark roundup citing Unbounce.
Median landing page conversion rate by industry
| Industry | Median Conversion Rate | What It Means for Target Setting |
|---|---|---|
| SaaS | 3.8% | A lower benchmark doesn’t excuse friction, but it does mean broad all-industry targets are misleading. |
| Ecommerce | 4.2% | If you’re near this on cold traffic, diagnose traffic quality before rewriting the whole page. |
| Professional services | 6.1% | This sits close to the global median, so page quality and offer framing usually show up more clearly. |
| Financial services | 8.3% | Higher intent or stronger need can support tougher targets, if tracking is clean. |
| Events and entertainment | 12.3% | High-intent actions and simpler offers can push rates well past the all-industry median. |
What founders usually get wrong
They benchmark against the global number because it feels neat. That’s lazy analysis.
An ecommerce page converting at 4.2% is not in the same universe as an events page at 12.3%. The traffic mindset, urgency, and action complexity are different. A founder comparing those pages as if they’re interchangeable will make the wrong optimisation call every time.
There’s a second trap. “Average” can make weak pages look acceptable. The best independent benchmark suggests that pages below 3% are usually underperforming, while 6% to 7% is a defensible baseline for mature lead-gen or ecommerce acquisition pages with decent traffic intent and message match, according to Unbounce’s benchmark report. If you’re under 3% on paid traffic and your offer isn’t unusually complex, start with the assumption that something is broken.
A useful planning ladder looks like this.
- Below 3%. Treat as a problem until proven otherwise.
- Around 4% to 5%. Potentially normal in lower-converting verticals or colder traffic mixes.
- Around 6% to 7%. A solid working baseline for many mature paid pages.
- 10% and above. Strong performance, usually because intent, proof, and friction are tightly aligned.
[[C11-OPTIN]]
How Traffic Source Device and Intent Change Your Rate
Your landing page rate is a weighted outcome. It isn’t a purity test for design taste.
If one campaign sends broad, cold mobile traffic and another sends warm branded desktop traffic, the pages can look similar while the conversion rates come out miles apart. That’s why broad averages mislead paid teams.
Device mix can quietly sink a “healthy” average
Recent benchmark coverage points to a widening gap between average and top performers, with the top 10% of pages at 11.7% or higher while the bottom quarter stays below 2%. The same source also reports mobile conversion at 2.8% versus 4.8% for desktop, which means your blended rate may reflect audience device mix as much as page quality, according to Roast’s 2026 landing page statistics roundup.
That’s not a small detail. It changes how you read performance.
A page doing fine on desktop can still be unscalable if most incremental spend lands on mobile and mobile is collapsing under long forms, clumsy layouts, or weak above-the-fold messaging. We see this constantly. The account-level number looks passable. The mobile segment is doing the damage.
Intent and friction do the real work
Top pages exceed 10% for a reason. They don’t win because someone rounded the corners on the button.
Benchmark summaries consistently show that performance is driven by offer-to-audience fit and friction in the conversion path, with 2% to 5% acting as a conservative generic range and 6% to 10% as competitive for lead gen. Longer forms, weaker trust signals and heavier qualification steps pull rates down, while simpler actions and higher-intent visitors tend to convert better, as outlined in ClickMinded’s benchmark summary.
Segment by source, device, offer and form type before you “optimise the page”. Otherwise you’re treating symptoms.
Operators earn their keep here. If paid search branded traffic converts brilliantly and paid social prospecting doesn’t, the page might be fine. The promise in the ad, the audience intent, or the qualification ask might be wrong. If retargeting works and cold traffic fails, don’t congratulate the page. You’ve learned that warmth is carrying the funnel.
If you need a sharper diagnosis of where Meta traffic is leaking before the click even reaches the page, this breakdown of what a Meta account audit finds is the place to start.
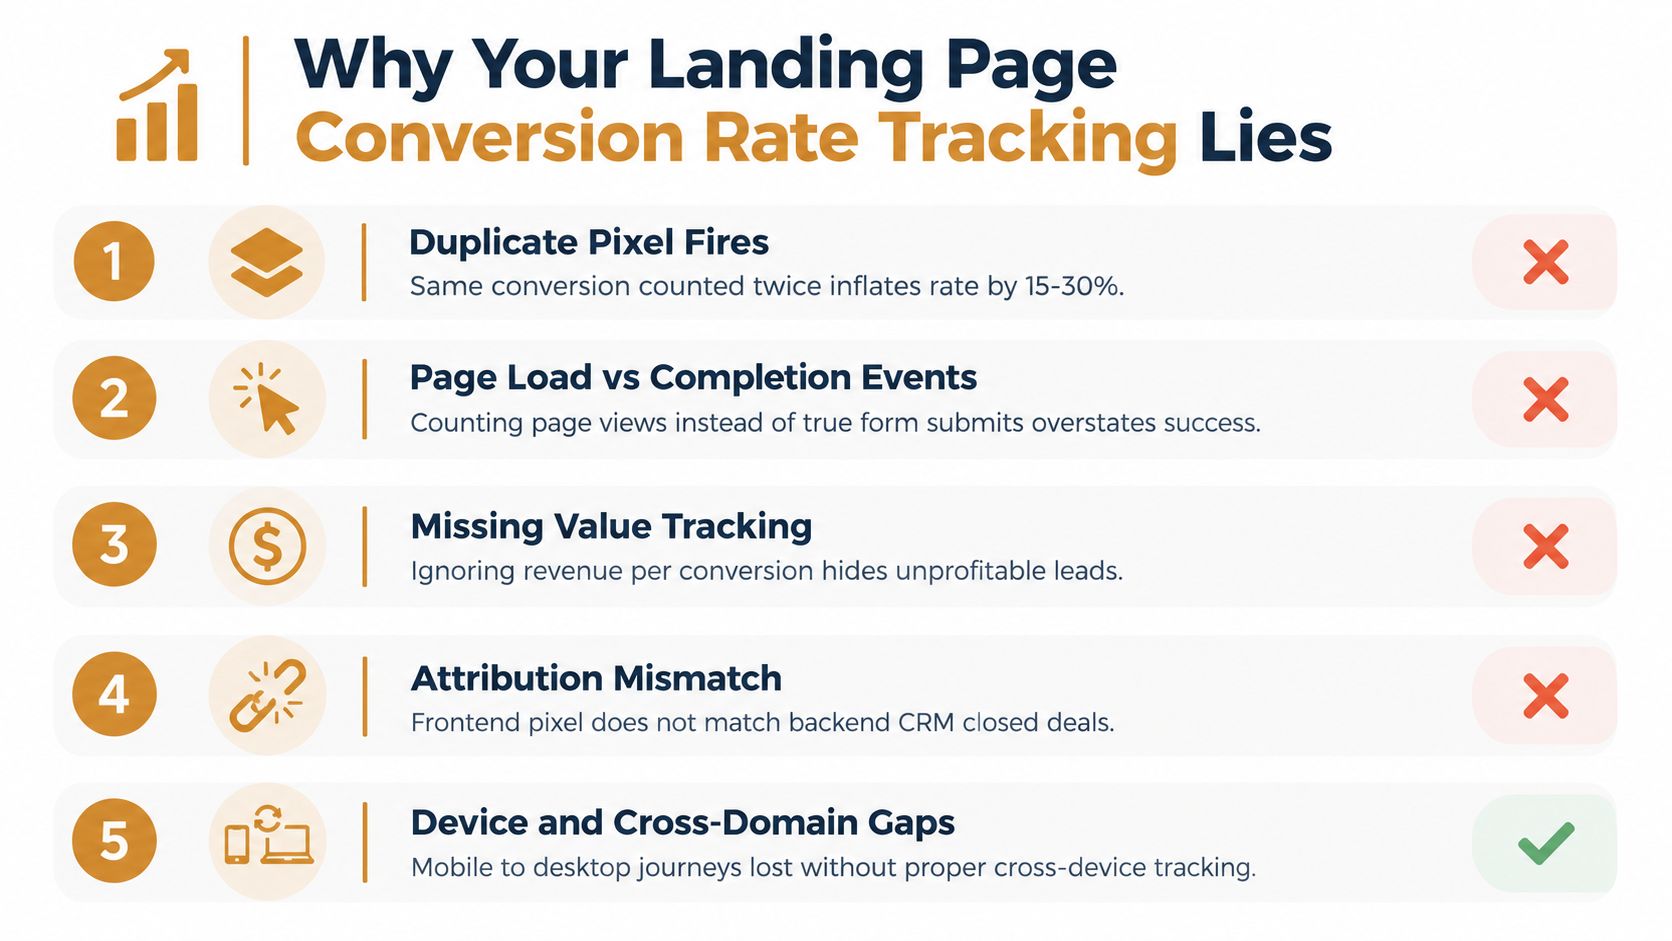
Why Your Landing Page Conversion Rate Tracking Lies
Before you test headlines, make sure the number is real.
As of 2026, plenty of accounts are still reporting inflated or incomplete conversion rates because the tracking setup is counting the wrong event, counting it twice, or failing to reconcile with what happened after the lead hit the backend.
Five checks before you trust the benchmark
-
Count completions, not page loads. If the conversion event fires on a thank-you page load that can refresh, revisit, or misfire, your rate is fiction.
-
Look for duplicate fires. Browser pixel plus server event without proper deduplication can inflate apparent success and hide funnel loss.
-
Match frontend conversions to backend outcomes. A pretty page-level CVR doesn’t help if low-quality leads never become qualified pipeline or valid orders.
-
Break out device paths. Mobile click to desktop completion can underreport one side and over-credit another if stitching is poor.
-
Check one primary action per page. If the page reports every soft action as a “conversion”, comparison against dedicated landing page medians becomes meaningless.
Use thresholds, not vibes
Here’s the checklist we use before any CRO sprint.
- If reported CVR looks strong but downstream CPA is worsening, audit event definitions before changing the page.
- If one traffic source looks brilliant and another awful, confirm both are optimising to the same real conversion.
- If mobile volume is high and mobile CVR is materially weaker than desktop, inspect the full path on an actual handset before changing media buying.
- If the CRM rejects or disqualifies a large share of leads, stop treating raw form submits as the success metric.
This is the unglamorous bit. It matters more than button colour.
For a proper diagnosis of tracking waste, duplicate events and attribution gaps, use the free ad account audit.
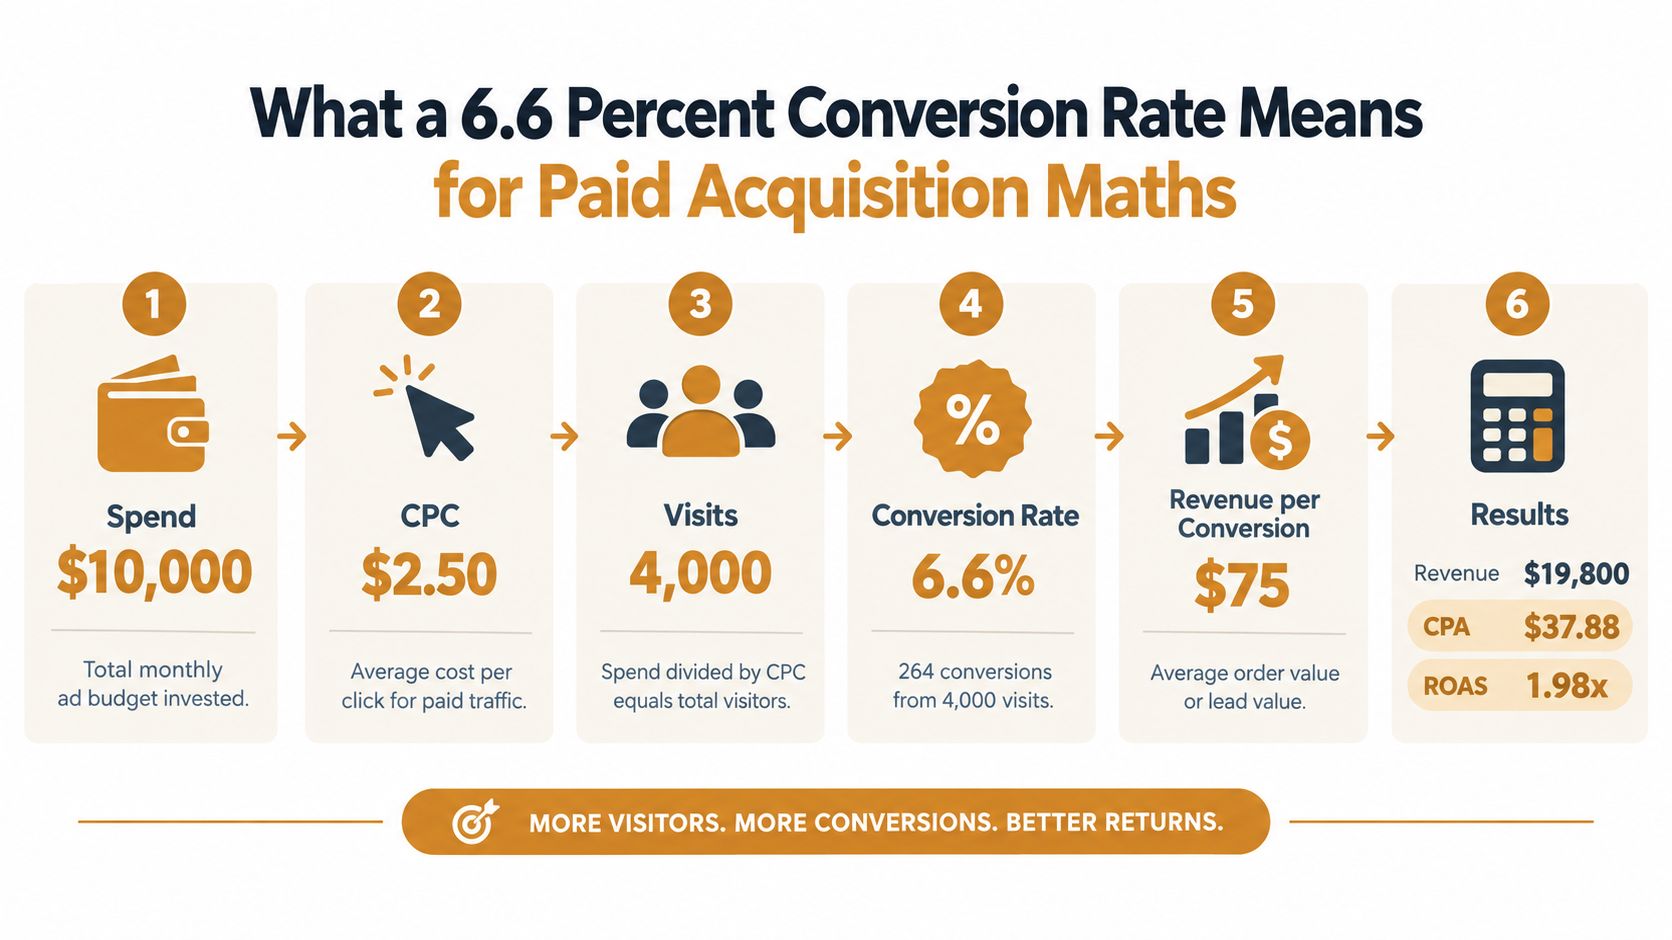
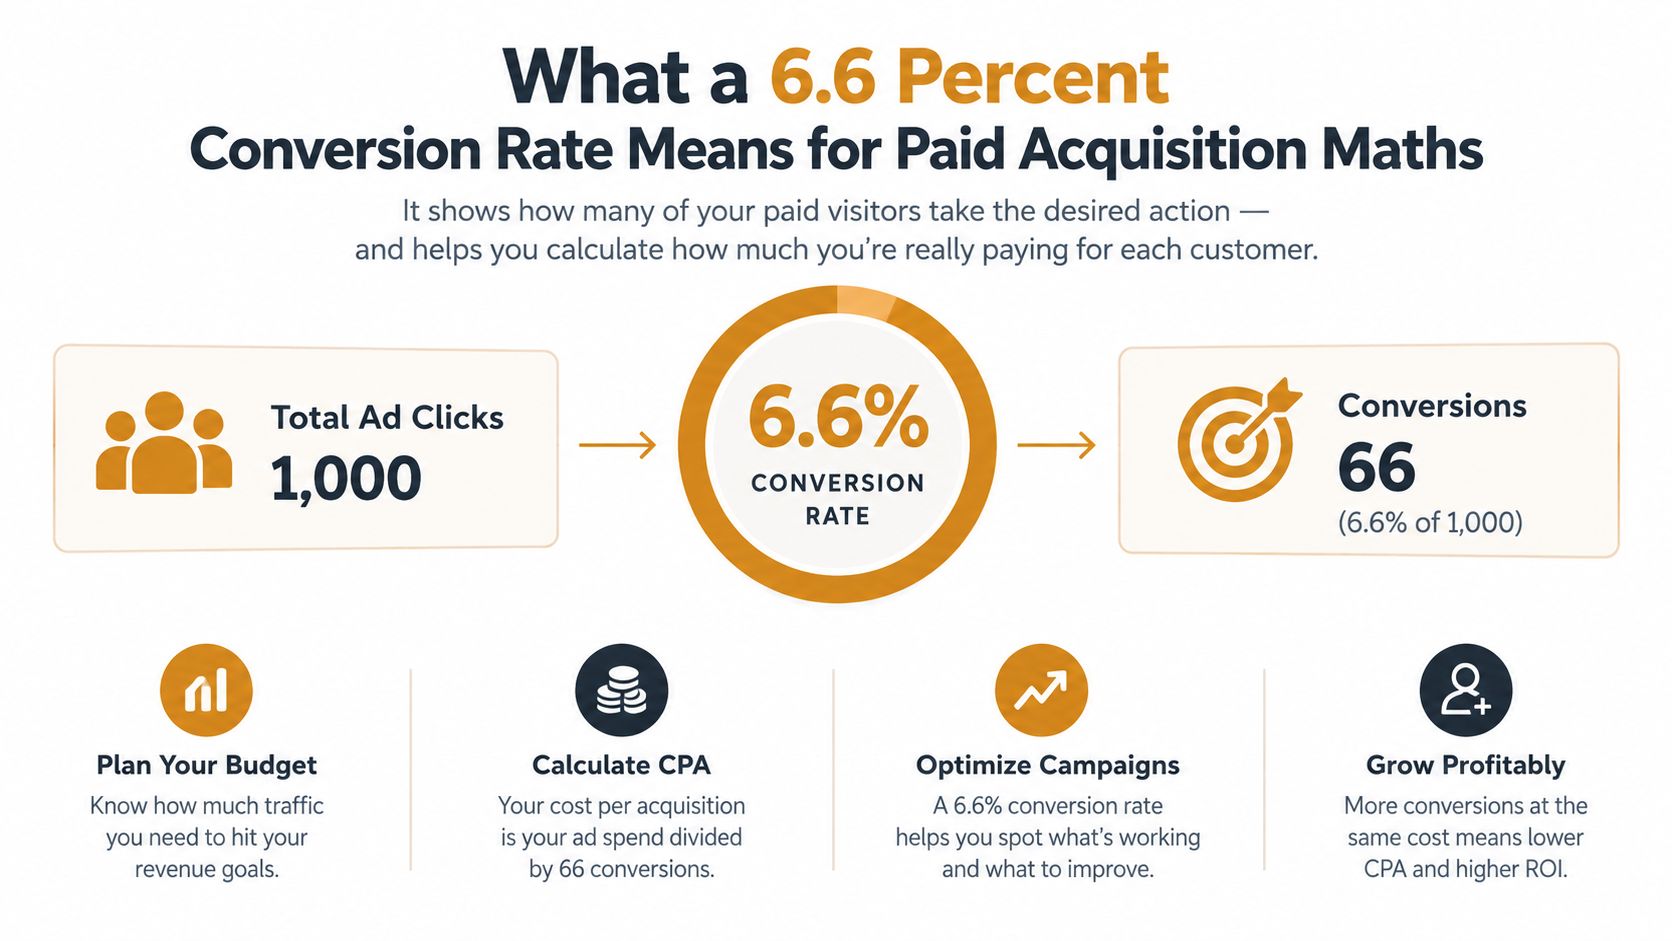
What a 6.6 Percent Conversion Rate Means for Paid Acquisition Maths
A conversion rate is only interesting once it hits the P and L.
At paid scale, a one point lift can fund more testing, absorb higher click costs, or pull CPA back into a range that lets you keep spending.
The worked example
Use monthly numbers. Keep it honest.
- Monthly ad spend: £30,000
- Average CPC: £2.50
- Landing page visits: 12,000
- Conversion rate: 6.6%
- Revenue per conversion: £75
Now the maths.
- Conversions at 6.6% = 12,000 × 0.066 = 792
- CPA at 6.6% = £30,000 ÷ 792 = £37.88
- Revenue = 792 × £75 = £59,400
- ROAS = £59,400 ÷ £30,000 = 1.98x
Now lift the page by one percentage point to 7.6%.
- Conversions at 7.6% = 12,000 × 0.076 = 912
- CPA at 7.6% = £30,000 ÷ 912 = £32.89
- Revenue = 912 × £75 = £68,400
- ROAS = £68,400 ÷ £30,000 = 2.28x
That extra point creates 120 more conversions in the month. It cuts CPA by £4.99. On a budget north of £30k, that’s the difference between “Meta’s getting expensive” and “the page is paying for our next test cycle”.
Why this matters more than people think
Most teams obsess over click costs because they see them first. Fair enough. But page conversion rate is where a lot of scale dies.
If your media buying is stable and click costs are rising, better page efficiency can protect MER without forcing you to slash spend or narrow prospecting too early. That’s also why creative production cadence matters. New hooks and tighter message match affect who lands, not just how many click. We covered that relationship in this breakdown of agency versus in-house cost maths.
Small lifts compound fastest in mature accounts, because the traffic bill is already large.
At Crank11, that’s the practical lens. Not “is 6.6% good”. More like “if we can buy one extra point of conversion from better message match, less friction and cleaner tracking, what does that do to CPA this month”.
How to Lift Your Landing Page Conversion Rate Above Average
Don’t start with design polish. Start with the failure that costs the most money.
The sequence matters more than the tactic. Teams waste months testing layouts when the problem is really message mismatch, over-qualification, or creative fatigue upstream.
The order we’d fix it
-
Fix tracking first
If event definitions are messy, stop. You can’t optimise noise. -
Check message match next
The ad promised something. The page has to cash it. If the click came for a specific claim, product angle or offer and the page opens with generic brand copy, conversion drops. -
Reduce unnecessary friction
Cut fields, steps, or qualification asks that don’t change fulfilment or sales follow-up. Keep the friction that improves lead quality. Bin the rest. -
Move proof higher
Cold paid traffic needs reassurance fast. Put proof near the decision point, not buried halfway down. -
Treat mobile as the main version
If most scale comes through mobile, optimise mobile first. Not as a responsive afterthought.
A simple operating checklist
- Below the useful baseline: if your paid page sits well under the benchmark range that fits your segment, test offer and message before fussing over layout.
- Good desktop, weak mobile: shorten forms, tighten the first screen, and remove clutter from the path.
- Warm traffic wins, cold traffic fails: improve ad to page continuity and proof, not just page cosmetics.
- Lead quality is poor: change the conversion definition or qualification step before celebrating a higher raw CVR.
If you’re feeding fresh traffic into stale angles every week, page gains won’t stick. That’s why the upstream creative system matters just as much as the page, and why we mapped the economics in this creative fatigue production maths post.
Crank11 is one option for teams that want senior operators to handle the sequence across paid traffic, creative and CRO, with no juniors in the loop.
The landing page audit template below shows exactly what to segment before you test and what to fix first.
[[C11-OPTIN]]
Quick answers
What is a good average landing page conversion rate
The cleanest baseline is 6.6% median across all industries from Unbounce’s 2024 benchmark. Good in practice depends on your industry, device mix, intent level and form friction.
Is 2% a bad landing page conversion rate
Usually, yes for a dedicated paid landing page. Recent benchmark coverage places the bottom quarter below 2%, which is a warning sign unless traffic is unusually cold or the conversion ask is heavy.
Is 10% landing page conversion rate good
Yes. Benchmark roundups consistently describe 10% and above as strong. Pages get there when intent is high, proof is obvious, and friction is controlled.
Why is my landing page conversion rate lower on mobile
Because mobile traffic often has lower intent, less patience and more friction tolerance issues. Recent benchmark coverage reports 2.8% mobile versus 4.8% desktop, so a blended average can hide mobile drag.
Should I use the all-industry average or my industry benchmark
Use your industry benchmark first. The spread from 3.8% in SaaS to 12.3% in events and entertainment is too wide for a universal target to be useful.
What should I do tomorrow morning
Segment your main landing page by source, device and offer, then recalculate CPA at current CVR and at a one point improvement. That tells you where optimisation is worth doing first.
If your paid traffic is already live and the page is the bottleneck, Crank 11 handles the practical bits that move the number, creative-message match, funnel fixes, tracking cleanup and structured CRO tied back to paid maths. Start by segmenting the page properly tomorrow morning, then use the playbook to decide whether the issue is traffic quality, mobile friction, or a broken measurement setup.